Immigrants from Cambodia vs Belizean College, 1 year or more
COMPARE
Immigrants from Cambodia
Belizean
College, 1 year or more
College, 1 year or more Comparison
Immigrants from Cambodia
Belizeans
55.4%
COLLEGE, 1 YEAR OR MORE
0.6/ 100
METRIC RATING
251st/ 347
METRIC RANK
54.4%
COLLEGE, 1 YEAR OR MORE
0.2/ 100
METRIC RATING
274th/ 347
METRIC RANK
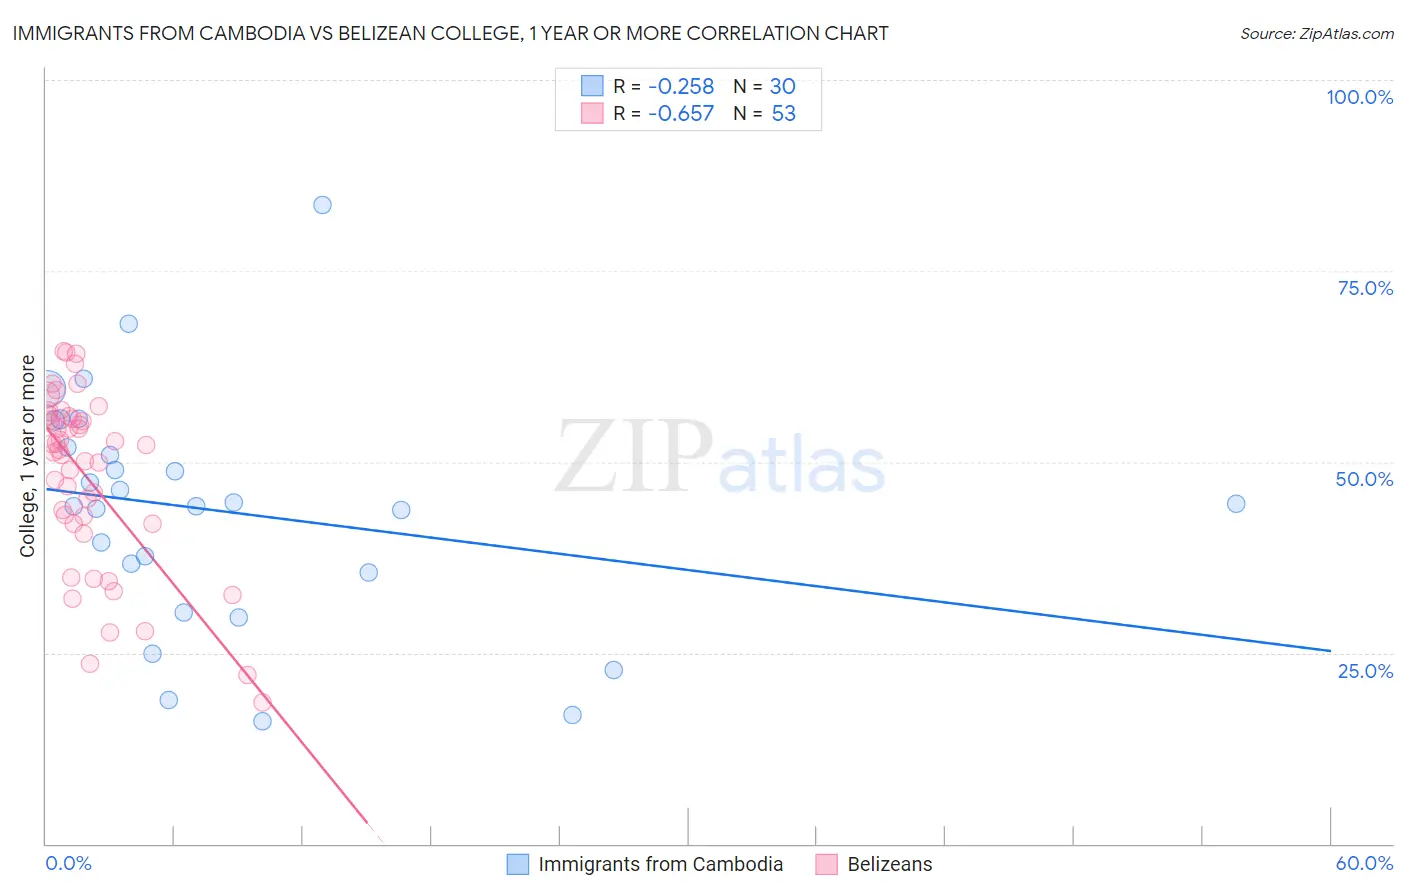
Immigrants from Cambodia vs Belizean College, 1 year or more Correlation Chart
The statistical analysis conducted on geographies consisting of 205,153,442 people shows a weak negative correlation between the proportion of Immigrants from Cambodia and percentage of population with at least college, 1 year or more education in the United States with a correlation coefficient (R) of -0.258 and weighted average of 55.4%. Similarly, the statistical analysis conducted on geographies consisting of 144,224,111 people shows a significant negative correlation between the proportion of Belizeans and percentage of population with at least college, 1 year or more education in the United States with a correlation coefficient (R) of -0.657 and weighted average of 54.4%, a difference of 1.9%.
College, 1 year or more Correlation Summary
| Measurement | Immigrants from Cambodia | Belizean |
| Minimum | 16.1% | 18.5% |
| Maximum | 83.7% | 64.4% |
| Range | 67.6% | 45.9% |
| Mean | 43.5% | 48.0% |
| Median | 44.3% | 51.6% |
| Interquartile 25% (IQ1) | 35.5% | 41.8% |
| Interquartile 75% (IQ3) | 51.9% | 55.8% |
| Interquartile Range (IQR) | 16.4% | 14.0% |
| Standard Deviation (Sample) | 15.3% | 11.5% |
| Standard Deviation (Population) | 15.1% | 11.4% |
Similar Demographics by College, 1 year or more
Demographics Similar to Immigrants from Cambodia by College, 1 year or more
In terms of college, 1 year or more, the demographic groups most similar to Immigrants from Cambodia are Aleut (55.4%, a difference of 0.030%), Delaware (55.5%, a difference of 0.090%), Immigrants from Trinidad and Tobago (55.5%, a difference of 0.11%), Immigrants from Barbados (55.4%, a difference of 0.13%), and Immigrants from Congo (55.6%, a difference of 0.21%).
| Demographics | Rating | Rank | College, 1 year or more |
| Chippewa | 0.9 /100 | #244 | Tragic 55.7% |
| Immigrants | Liberia | 0.8 /100 | #245 | Tragic 55.7% |
| Malaysians | 0.8 /100 | #246 | Tragic 55.6% |
| Hawaiians | 0.8 /100 | #247 | Tragic 55.6% |
| Immigrants | Congo | 0.8 /100 | #248 | Tragic 55.6% |
| Immigrants | Trinidad and Tobago | 0.7 /100 | #249 | Tragic 55.5% |
| Delaware | 0.7 /100 | #250 | Tragic 55.5% |
| Immigrants | Cambodia | 0.6 /100 | #251 | Tragic 55.4% |
| Aleuts | 0.6 /100 | #252 | Tragic 55.4% |
| Immigrants | Barbados | 0.6 /100 | #253 | Tragic 55.4% |
| Japanese | 0.5 /100 | #254 | Tragic 55.2% |
| Immigrants | Bahamas | 0.5 /100 | #255 | Tragic 55.2% |
| Immigrants | West Indies | 0.5 /100 | #256 | Tragic 55.2% |
| Indonesians | 0.4 /100 | #257 | Tragic 55.1% |
| Africans | 0.4 /100 | #258 | Tragic 55.0% |
Demographics Similar to Belizeans by College, 1 year or more
In terms of college, 1 year or more, the demographic groups most similar to Belizeans are American (54.4%, a difference of 0.020%), Immigrants from Grenada (54.4%, a difference of 0.040%), Comanche (54.4%, a difference of 0.080%), Shoshone (54.3%, a difference of 0.11%), and Bahamian (54.5%, a difference of 0.12%).
| Demographics | Rating | Rank | College, 1 year or more |
| Blackfeet | 0.2 /100 | #267 | Tragic 54.6% |
| British West Indians | 0.2 /100 | #268 | Tragic 54.5% |
| Bangladeshis | 0.2 /100 | #269 | Tragic 54.5% |
| Crow | 0.2 /100 | #270 | Tragic 54.5% |
| Bahamians | 0.2 /100 | #271 | Tragic 54.5% |
| Comanche | 0.2 /100 | #272 | Tragic 54.4% |
| Immigrants | Grenada | 0.2 /100 | #273 | Tragic 54.4% |
| Belizeans | 0.2 /100 | #274 | Tragic 54.4% |
| Americans | 0.2 /100 | #275 | Tragic 54.4% |
| Shoshone | 0.2 /100 | #276 | Tragic 54.3% |
| Ecuadorians | 0.2 /100 | #277 | Tragic 54.3% |
| Immigrants | Jamaica | 0.1 /100 | #278 | Tragic 54.2% |
| Arapaho | 0.1 /100 | #279 | Tragic 54.1% |
| Cheyenne | 0.1 /100 | #280 | Tragic 54.1% |
| Colville | 0.1 /100 | #281 | Tragic 54.1% |