Immigrants from Cambodia vs Native/Alaskan College, 1 year or more
COMPARE
Immigrants from Cambodia
Native/Alaskan
College, 1 year or more
College, 1 year or more Comparison
Immigrants from Cambodia
Natives/Alaskans
55.4%
COLLEGE, 1 YEAR OR MORE
0.6/ 100
METRIC RATING
251st/ 347
METRIC RANK
50.2%
COLLEGE, 1 YEAR OR MORE
0.0/ 100
METRIC RATING
330th/ 347
METRIC RANK
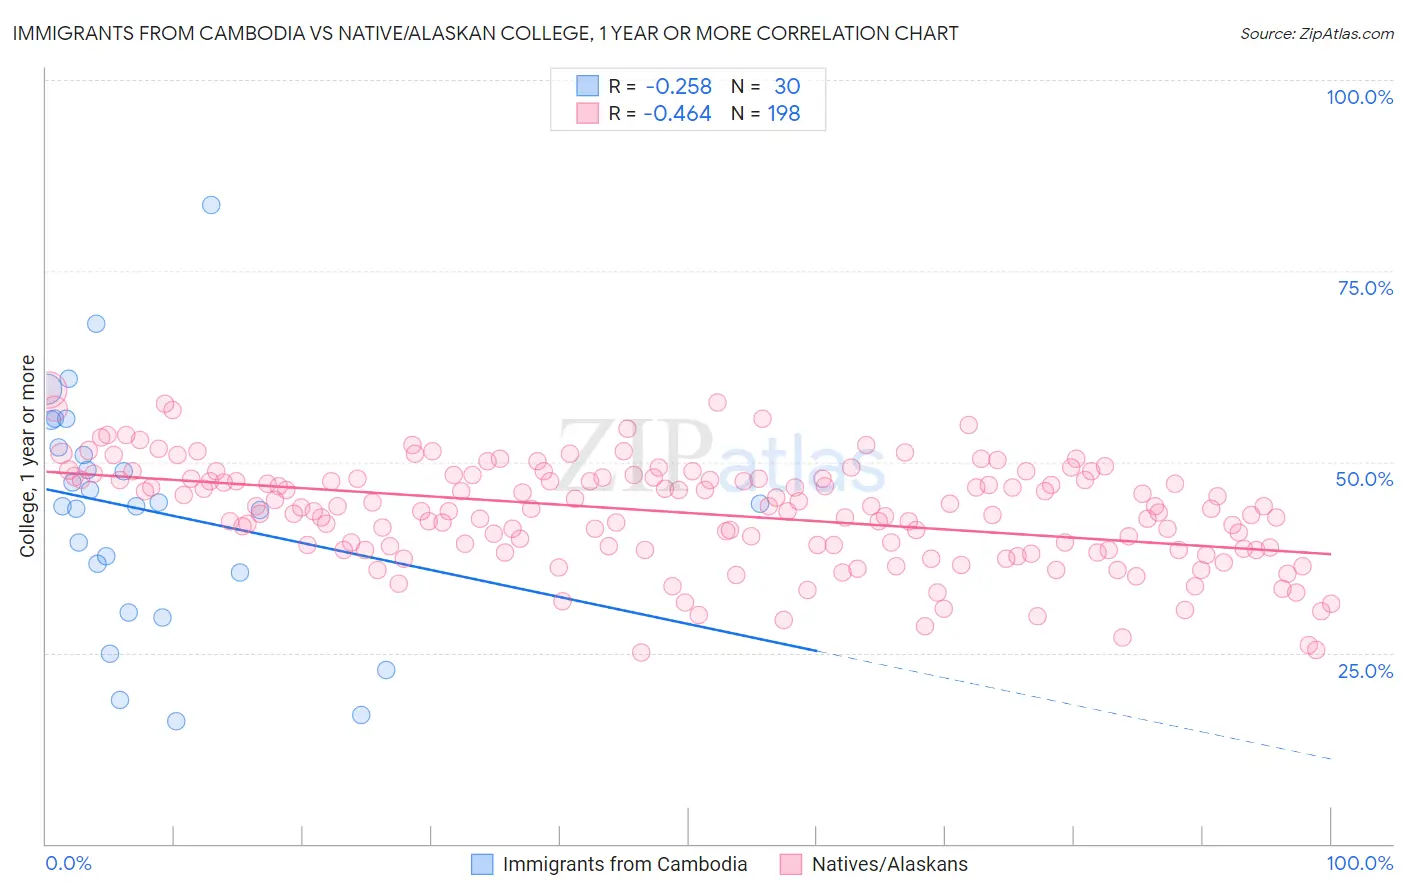
Immigrants from Cambodia vs Native/Alaskan College, 1 year or more Correlation Chart
The statistical analysis conducted on geographies consisting of 205,153,442 people shows a weak negative correlation between the proportion of Immigrants from Cambodia and percentage of population with at least college, 1 year or more education in the United States with a correlation coefficient (R) of -0.258 and weighted average of 55.4%. Similarly, the statistical analysis conducted on geographies consisting of 513,066,104 people shows a moderate negative correlation between the proportion of Natives/Alaskans and percentage of population with at least college, 1 year or more education in the United States with a correlation coefficient (R) of -0.464 and weighted average of 50.2%, a difference of 10.4%.
College, 1 year or more Correlation Summary
| Measurement | Immigrants from Cambodia | Native/Alaskan |
| Minimum | 16.1% | 25.1% |
| Maximum | 83.7% | 59.4% |
| Range | 67.6% | 34.4% |
| Mean | 43.5% | 43.3% |
| Median | 44.3% | 43.9% |
| Interquartile 25% (IQ1) | 35.5% | 38.6% |
| Interquartile 75% (IQ3) | 51.9% | 47.9% |
| Interquartile Range (IQR) | 16.4% | 9.2% |
| Standard Deviation (Sample) | 15.3% | 6.8% |
| Standard Deviation (Population) | 15.1% | 6.8% |
Similar Demographics by College, 1 year or more
Demographics Similar to Immigrants from Cambodia by College, 1 year or more
In terms of college, 1 year or more, the demographic groups most similar to Immigrants from Cambodia are Aleut (55.4%, a difference of 0.030%), Delaware (55.5%, a difference of 0.090%), Immigrants from Trinidad and Tobago (55.5%, a difference of 0.11%), Immigrants from Barbados (55.4%, a difference of 0.13%), and Immigrants from Congo (55.6%, a difference of 0.21%).
| Demographics | Rating | Rank | College, 1 year or more |
| Chippewa | 0.9 /100 | #244 | Tragic 55.7% |
| Immigrants | Liberia | 0.8 /100 | #245 | Tragic 55.7% |
| Malaysians | 0.8 /100 | #246 | Tragic 55.6% |
| Hawaiians | 0.8 /100 | #247 | Tragic 55.6% |
| Immigrants | Congo | 0.8 /100 | #248 | Tragic 55.6% |
| Immigrants | Trinidad and Tobago | 0.7 /100 | #249 | Tragic 55.5% |
| Delaware | 0.7 /100 | #250 | Tragic 55.5% |
| Immigrants | Cambodia | 0.6 /100 | #251 | Tragic 55.4% |
| Aleuts | 0.6 /100 | #252 | Tragic 55.4% |
| Immigrants | Barbados | 0.6 /100 | #253 | Tragic 55.4% |
| Japanese | 0.5 /100 | #254 | Tragic 55.2% |
| Immigrants | Bahamas | 0.5 /100 | #255 | Tragic 55.2% |
| Immigrants | West Indies | 0.5 /100 | #256 | Tragic 55.2% |
| Indonesians | 0.4 /100 | #257 | Tragic 55.1% |
| Africans | 0.4 /100 | #258 | Tragic 55.0% |
Demographics Similar to Natives/Alaskans by College, 1 year or more
In terms of college, 1 year or more, the demographic groups most similar to Natives/Alaskans are Cape Verdean (50.3%, a difference of 0.22%), Immigrants from Yemen (50.0%, a difference of 0.35%), Dutch West Indian (50.5%, a difference of 0.62%), Menominee (50.6%, a difference of 0.74%), and Dominican (50.6%, a difference of 0.77%).
| Demographics | Rating | Rank | College, 1 year or more |
| Immigrants | Guatemala | 0.0 /100 | #323 | Tragic 50.7% |
| Immigrants | Cuba | 0.0 /100 | #324 | Tragic 50.7% |
| Immigrants | Latin America | 0.0 /100 | #325 | Tragic 50.7% |
| Dominicans | 0.0 /100 | #326 | Tragic 50.6% |
| Menominee | 0.0 /100 | #327 | Tragic 50.6% |
| Dutch West Indians | 0.0 /100 | #328 | Tragic 50.5% |
| Cape Verdeans | 0.0 /100 | #329 | Tragic 50.3% |
| Natives/Alaskans | 0.0 /100 | #330 | Tragic 50.2% |
| Immigrants | Yemen | 0.0 /100 | #331 | Tragic 50.0% |
| Mexicans | 0.0 /100 | #332 | Tragic 49.2% |
| Immigrants | Dominican Republic | 0.0 /100 | #333 | Tragic 49.1% |
| Lumbee | 0.0 /100 | #334 | Tragic 48.9% |
| Yuman | 0.0 /100 | #335 | Tragic 48.7% |
| Spanish American Indians | 0.0 /100 | #336 | Tragic 48.5% |
| Pennsylvania Germans | 0.0 /100 | #337 | Tragic 48.5% |