Czech vs Belizean College, 1 year or more
COMPARE
Czech
Belizean
College, 1 year or more
College, 1 year or more Comparison
Czechs
Belizeans
60.6%
COLLEGE, 1 YEAR OR MORE
81.9/ 100
METRIC RATING
144th/ 347
METRIC RANK
54.4%
COLLEGE, 1 YEAR OR MORE
0.2/ 100
METRIC RATING
274th/ 347
METRIC RANK
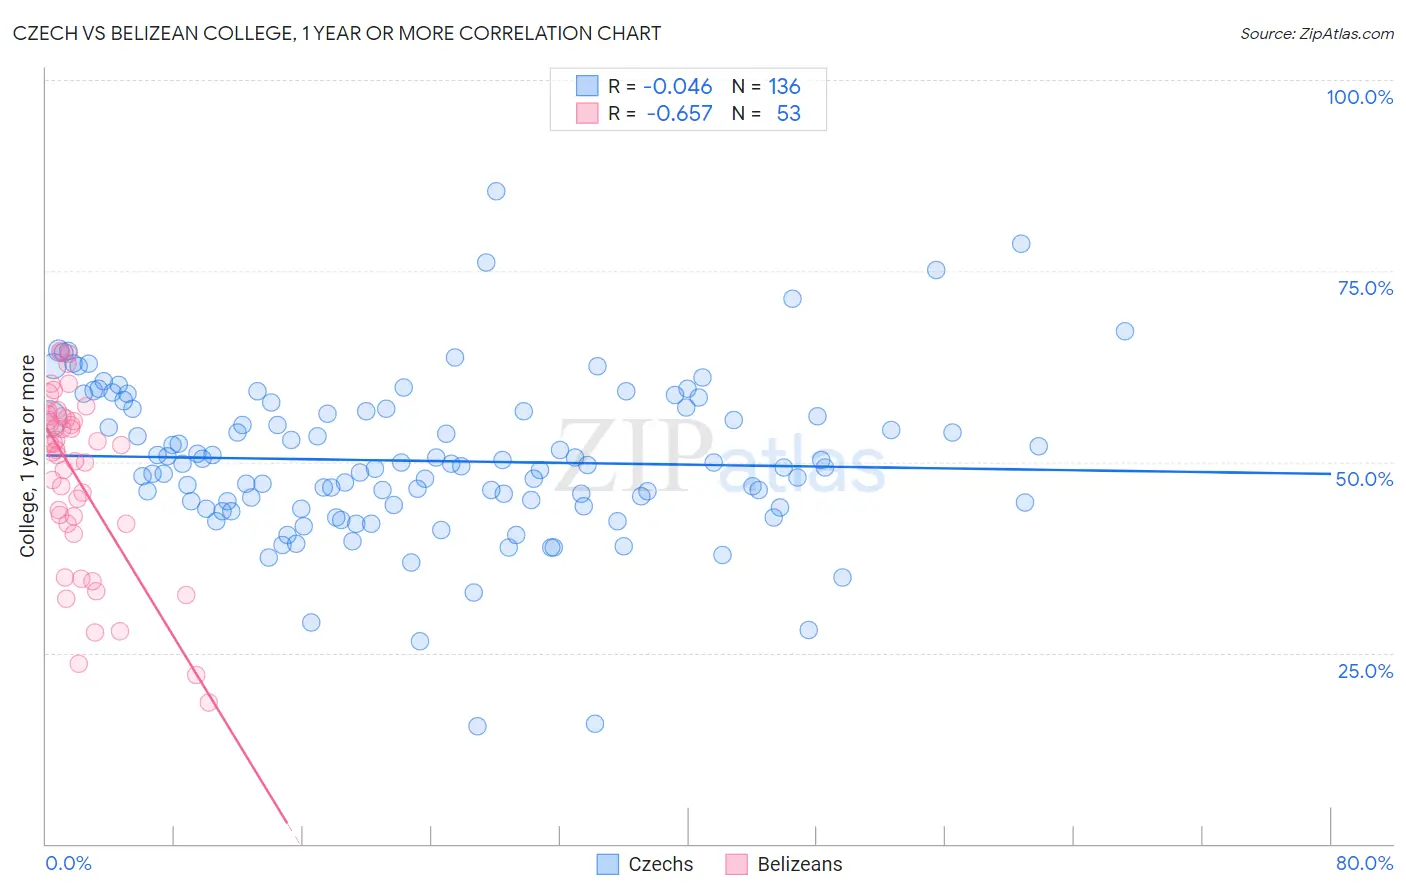
Czech vs Belizean College, 1 year or more Correlation Chart
The statistical analysis conducted on geographies consisting of 484,810,404 people shows no correlation between the proportion of Czechs and percentage of population with at least college, 1 year or more education in the United States with a correlation coefficient (R) of -0.046 and weighted average of 60.6%. Similarly, the statistical analysis conducted on geographies consisting of 144,224,111 people shows a significant negative correlation between the proportion of Belizeans and percentage of population with at least college, 1 year or more education in the United States with a correlation coefficient (R) of -0.657 and weighted average of 54.4%, a difference of 11.4%.
College, 1 year or more Correlation Summary
| Measurement | Czech | Belizean |
| Minimum | 15.4% | 18.5% |
| Maximum | 85.4% | 64.4% |
| Range | 70.0% | 45.9% |
| Mean | 50.1% | 48.0% |
| Median | 49.5% | 51.6% |
| Interquartile 25% (IQ1) | 44.3% | 41.8% |
| Interquartile 75% (IQ3) | 56.8% | 55.8% |
| Interquartile Range (IQR) | 12.5% | 14.0% |
| Standard Deviation (Sample) | 10.5% | 11.5% |
| Standard Deviation (Population) | 10.4% | 11.4% |
Similar Demographics by College, 1 year or more
Demographics Similar to Czechs by College, 1 year or more
In terms of college, 1 year or more, the demographic groups most similar to Czechs are Slavic (60.6%, a difference of 0.070%), Polish (60.7%, a difference of 0.080%), Canadian (60.6%, a difference of 0.080%), Immigrants from Afghanistan (60.7%, a difference of 0.11%), and Iraqi (60.7%, a difference of 0.13%).
| Demographics | Rating | Rank | College, 1 year or more |
| Slovenes | 86.5 /100 | #137 | Excellent 60.9% |
| Taiwanese | 84.3 /100 | #138 | Excellent 60.7% |
| Immigrants | Eritrea | 84.3 /100 | #139 | Excellent 60.7% |
| Iraqis | 83.3 /100 | #140 | Excellent 60.7% |
| Immigrants | Afghanistan | 83.1 /100 | #141 | Excellent 60.7% |
| Poles | 82.8 /100 | #142 | Excellent 60.7% |
| Canadians | 82.7 /100 | #143 | Excellent 60.6% |
| Czechs | 81.9 /100 | #144 | Excellent 60.6% |
| Slavs | 81.1 /100 | #145 | Excellent 60.6% |
| Scottish | 80.2 /100 | #146 | Excellent 60.5% |
| Immigrants | Kenya | 79.1 /100 | #147 | Good 60.5% |
| Kenyans | 79.0 /100 | #148 | Good 60.5% |
| Brazilians | 79.0 /100 | #149 | Good 60.5% |
| Immigrants | Sudan | 77.8 /100 | #150 | Good 60.4% |
| Albanians | 77.8 /100 | #151 | Good 60.4% |
Demographics Similar to Belizeans by College, 1 year or more
In terms of college, 1 year or more, the demographic groups most similar to Belizeans are American (54.4%, a difference of 0.020%), Immigrants from Grenada (54.4%, a difference of 0.040%), Comanche (54.4%, a difference of 0.080%), Shoshone (54.3%, a difference of 0.11%), and Bahamian (54.5%, a difference of 0.12%).
| Demographics | Rating | Rank | College, 1 year or more |
| Blackfeet | 0.2 /100 | #267 | Tragic 54.6% |
| British West Indians | 0.2 /100 | #268 | Tragic 54.5% |
| Bangladeshis | 0.2 /100 | #269 | Tragic 54.5% |
| Crow | 0.2 /100 | #270 | Tragic 54.5% |
| Bahamians | 0.2 /100 | #271 | Tragic 54.5% |
| Comanche | 0.2 /100 | #272 | Tragic 54.4% |
| Immigrants | Grenada | 0.2 /100 | #273 | Tragic 54.4% |
| Belizeans | 0.2 /100 | #274 | Tragic 54.4% |
| Americans | 0.2 /100 | #275 | Tragic 54.4% |
| Shoshone | 0.2 /100 | #276 | Tragic 54.3% |
| Ecuadorians | 0.2 /100 | #277 | Tragic 54.3% |
| Immigrants | Jamaica | 0.1 /100 | #278 | Tragic 54.2% |
| Arapaho | 0.1 /100 | #279 | Tragic 54.1% |
| Cheyenne | 0.1 /100 | #280 | Tragic 54.1% |
| Colville | 0.1 /100 | #281 | Tragic 54.1% |