Hispanic or Latino vs Belizean College, 1 year or more
COMPARE
Hispanic or Latino
Belizean
College, 1 year or more
College, 1 year or more Comparison
Hispanics or Latinos
Belizeans
51.1%
COLLEGE, 1 YEAR OR MORE
0.0/ 100
METRIC RATING
317th/ 347
METRIC RANK
54.4%
COLLEGE, 1 YEAR OR MORE
0.2/ 100
METRIC RATING
274th/ 347
METRIC RANK
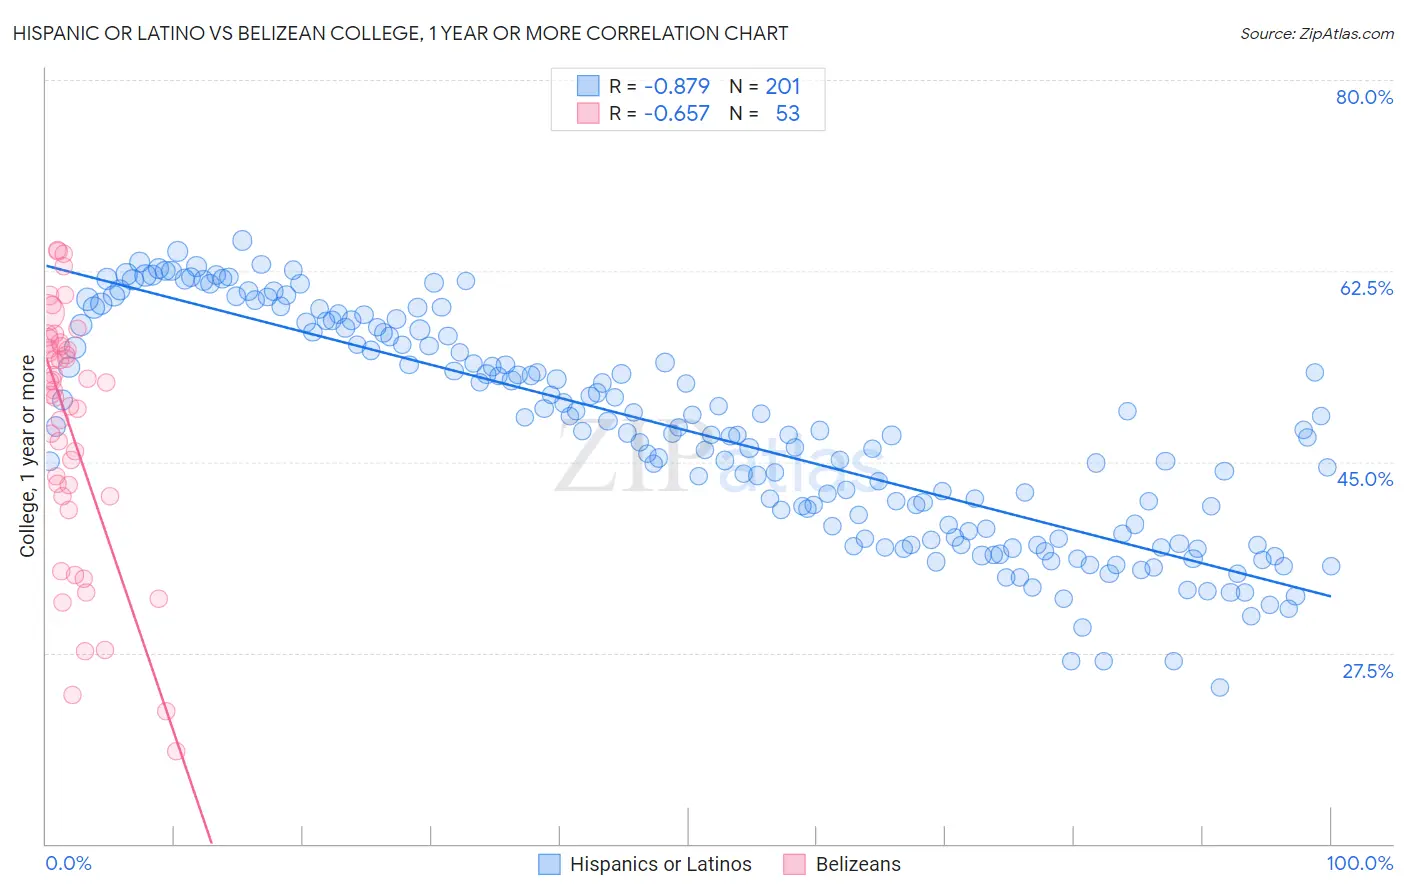
Hispanic or Latino vs Belizean College, 1 year or more Correlation Chart
The statistical analysis conducted on geographies consisting of 578,586,619 people shows a very strong negative correlation between the proportion of Hispanics or Latinos and percentage of population with at least college, 1 year or more education in the United States with a correlation coefficient (R) of -0.879 and weighted average of 51.1%. Similarly, the statistical analysis conducted on geographies consisting of 144,224,111 people shows a significant negative correlation between the proportion of Belizeans and percentage of population with at least college, 1 year or more education in the United States with a correlation coefficient (R) of -0.657 and weighted average of 54.4%, a difference of 6.4%.
College, 1 year or more Correlation Summary
| Measurement | Hispanic or Latino | Belizean |
| Minimum | 24.4% | 18.5% |
| Maximum | 65.3% | 64.4% |
| Range | 40.9% | 45.9% |
| Mean | 47.8% | 48.0% |
| Median | 47.8% | 51.6% |
| Interquartile 25% (IQ1) | 38.2% | 41.8% |
| Interquartile 75% (IQ3) | 57.0% | 55.8% |
| Interquartile Range (IQR) | 18.8% | 14.0% |
| Standard Deviation (Sample) | 10.0% | 11.5% |
| Standard Deviation (Population) | 10.0% | 11.4% |
Similar Demographics by College, 1 year or more
Demographics Similar to Hispanics or Latinos by College, 1 year or more
In terms of college, 1 year or more, the demographic groups most similar to Hispanics or Latinos are Cajun (51.2%, a difference of 0.090%), Immigrants from Honduras (51.0%, a difference of 0.13%), Guatemalan (51.2%, a difference of 0.16%), Immigrants from El Salvador (51.0%, a difference of 0.22%), and Kiowa (51.0%, a difference of 0.28%).
| Demographics | Rating | Rank | College, 1 year or more |
| Hondurans | 0.0 /100 | #310 | Tragic 51.6% |
| Immigrants | Haiti | 0.0 /100 | #311 | Tragic 51.5% |
| Pueblo | 0.0 /100 | #312 | Tragic 51.5% |
| Immigrants | Caribbean | 0.0 /100 | #313 | Tragic 51.4% |
| Fijians | 0.0 /100 | #314 | Tragic 51.3% |
| Guatemalans | 0.0 /100 | #315 | Tragic 51.2% |
| Cajuns | 0.0 /100 | #316 | Tragic 51.2% |
| Hispanics or Latinos | 0.0 /100 | #317 | Tragic 51.1% |
| Immigrants | Honduras | 0.0 /100 | #318 | Tragic 51.0% |
| Immigrants | El Salvador | 0.0 /100 | #319 | Tragic 51.0% |
| Kiowa | 0.0 /100 | #320 | Tragic 51.0% |
| Hopi | 0.0 /100 | #321 | Tragic 50.9% |
| Navajo | 0.0 /100 | #322 | Tragic 50.8% |
| Immigrants | Guatemala | 0.0 /100 | #323 | Tragic 50.7% |
| Immigrants | Cuba | 0.0 /100 | #324 | Tragic 50.7% |
Demographics Similar to Belizeans by College, 1 year or more
In terms of college, 1 year or more, the demographic groups most similar to Belizeans are American (54.4%, a difference of 0.020%), Immigrants from Grenada (54.4%, a difference of 0.040%), Comanche (54.4%, a difference of 0.080%), Shoshone (54.3%, a difference of 0.11%), and Bahamian (54.5%, a difference of 0.12%).
| Demographics | Rating | Rank | College, 1 year or more |
| Blackfeet | 0.2 /100 | #267 | Tragic 54.6% |
| British West Indians | 0.2 /100 | #268 | Tragic 54.5% |
| Bangladeshis | 0.2 /100 | #269 | Tragic 54.5% |
| Crow | 0.2 /100 | #270 | Tragic 54.5% |
| Bahamians | 0.2 /100 | #271 | Tragic 54.5% |
| Comanche | 0.2 /100 | #272 | Tragic 54.4% |
| Immigrants | Grenada | 0.2 /100 | #273 | Tragic 54.4% |
| Belizeans | 0.2 /100 | #274 | Tragic 54.4% |
| Americans | 0.2 /100 | #275 | Tragic 54.4% |
| Shoshone | 0.2 /100 | #276 | Tragic 54.3% |
| Ecuadorians | 0.2 /100 | #277 | Tragic 54.3% |
| Immigrants | Jamaica | 0.1 /100 | #278 | Tragic 54.2% |
| Arapaho | 0.1 /100 | #279 | Tragic 54.1% |
| Cheyenne | 0.1 /100 | #280 | Tragic 54.1% |
| Colville | 0.1 /100 | #281 | Tragic 54.1% |