Immigrants from Burma/Myanmar vs Immigrants from India 11th Grade
COMPARE
Immigrants from Burma/Myanmar
Immigrants from India
11th Grade
11th Grade Comparison
Immigrants from Burma/Myanmar
Immigrants from India
90.4%
11TH GRADE
0.0/ 100
METRIC RATING
285th/ 347
METRIC RANK
94.5%
11TH GRADE
100.0/ 100
METRIC RATING
16th/ 347
METRIC RANK
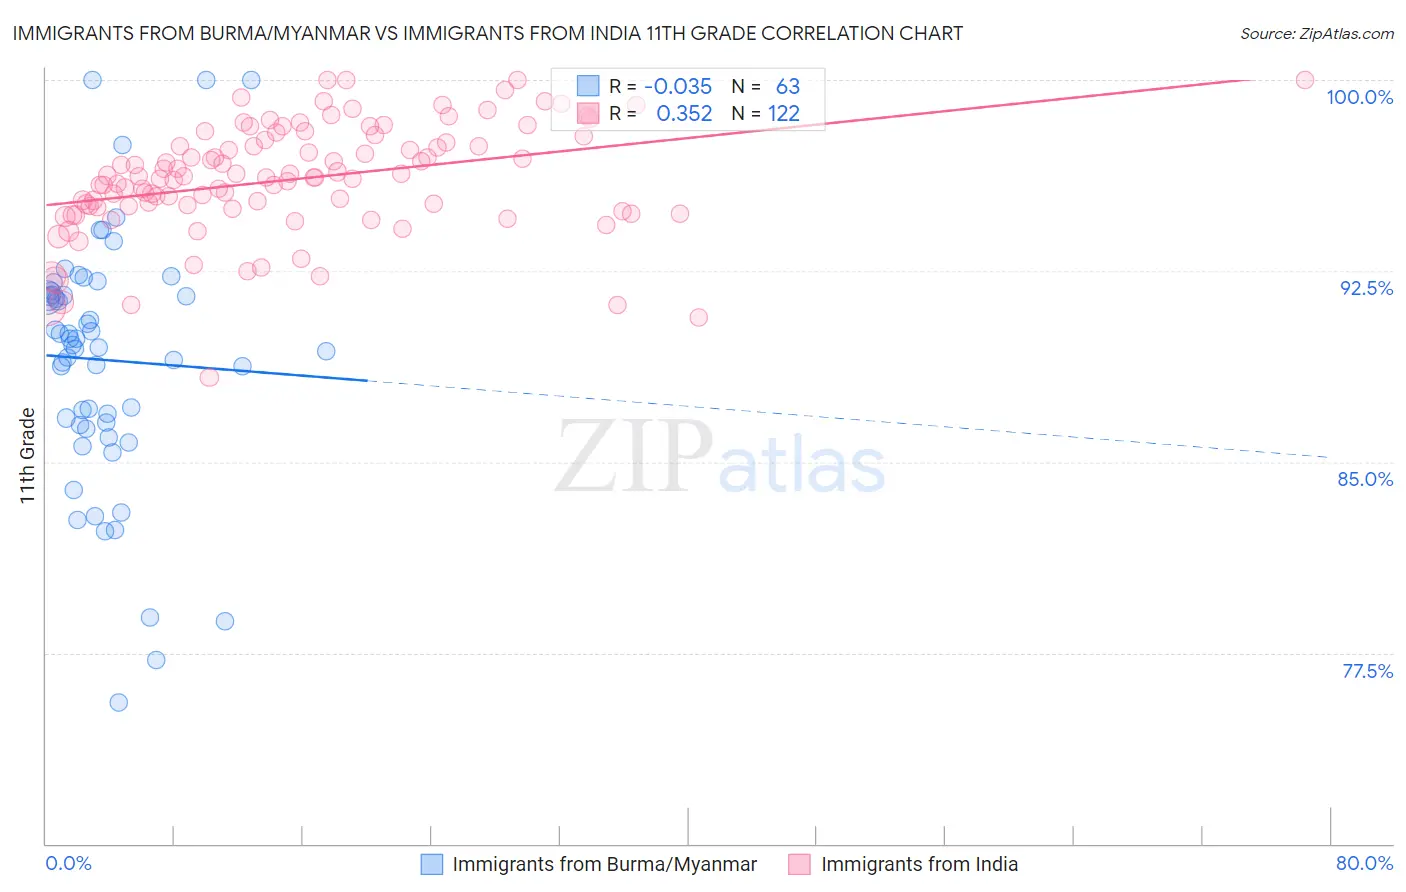
Immigrants from Burma/Myanmar vs Immigrants from India 11th Grade Correlation Chart
The statistical analysis conducted on geographies consisting of 172,345,696 people shows no correlation between the proportion of Immigrants from Burma/Myanmar and percentage of population with at least 11th grade education in the United States with a correlation coefficient (R) of -0.035 and weighted average of 90.4%. Similarly, the statistical analysis conducted on geographies consisting of 434,105,625 people shows a mild positive correlation between the proportion of Immigrants from India and percentage of population with at least 11th grade education in the United States with a correlation coefficient (R) of 0.352 and weighted average of 94.5%, a difference of 4.5%.
11th Grade Correlation Summary
| Measurement | Immigrants from Burma/Myanmar | Immigrants from India |
| Minimum | 75.6% | 88.3% |
| Maximum | 100.0% | 100.0% |
| Range | 24.4% | 11.7% |
| Mean | 89.0% | 96.1% |
| Median | 89.6% | 96.2% |
| Interquartile 25% (IQ1) | 86.4% | 95.0% |
| Interquartile 75% (IQ3) | 91.6% | 97.7% |
| Interquartile Range (IQR) | 5.1% | 2.7% |
| Standard Deviation (Sample) | 4.9% | 2.2% |
| Standard Deviation (Population) | 4.9% | 2.2% |
Similar Demographics by 11th Grade
Demographics Similar to Immigrants from Burma/Myanmar by 11th Grade
In terms of 11th grade, the demographic groups most similar to Immigrants from Burma/Myanmar are Immigrants from West Indies (90.4%, a difference of 0.050%), Apache (90.4%, a difference of 0.060%), Pennsylvania German (90.3%, a difference of 0.080%), Immigrants from Laos (90.5%, a difference of 0.090%), and British West Indian (90.3%, a difference of 0.11%).
| Demographics | Rating | Rank | 11th Grade |
| Malaysians | 0.1 /100 | #278 | Tragic 90.8% |
| Barbadians | 0.0 /100 | #279 | Tragic 90.8% |
| Sri Lankans | 0.0 /100 | #280 | Tragic 90.7% |
| Dutch West Indians | 0.0 /100 | #281 | Tragic 90.7% |
| Immigrants | St. Vincent and the Grenadines | 0.0 /100 | #282 | Tragic 90.7% |
| Immigrants | Barbados | 0.0 /100 | #283 | Tragic 90.7% |
| Immigrants | Laos | 0.0 /100 | #284 | Tragic 90.5% |
| Immigrants | Burma/Myanmar | 0.0 /100 | #285 | Tragic 90.4% |
| Immigrants | West Indies | 0.0 /100 | #286 | Tragic 90.4% |
| Apache | 0.0 /100 | #287 | Tragic 90.4% |
| Pennsylvania Germans | 0.0 /100 | #288 | Tragic 90.3% |
| British West Indians | 0.0 /100 | #289 | Tragic 90.3% |
| Indonesians | 0.0 /100 | #290 | Tragic 90.3% |
| Haitians | 0.0 /100 | #291 | Tragic 90.3% |
| Cubans | 0.0 /100 | #292 | Tragic 90.2% |
Demographics Similar to Immigrants from India by 11th Grade
In terms of 11th grade, the demographic groups most similar to Immigrants from India are Luxembourger (94.5%, a difference of 0.0%), Bulgarian (94.5%, a difference of 0.010%), Maltese (94.5%, a difference of 0.010%), Scandinavian (94.5%, a difference of 0.010%), and Italian (94.5%, a difference of 0.040%).
| Demographics | Rating | Rank | 11th Grade |
| Danes | 100.0 /100 | #9 | Exceptional 94.7% |
| Finns | 100.0 /100 | #10 | Exceptional 94.7% |
| Germans | 100.0 /100 | #11 | Exceptional 94.7% |
| Latvians | 100.0 /100 | #12 | Exceptional 94.7% |
| Chinese | 100.0 /100 | #13 | Exceptional 94.6% |
| Eastern Europeans | 100.0 /100 | #14 | Exceptional 94.6% |
| Bulgarians | 100.0 /100 | #15 | Exceptional 94.5% |
| Immigrants | India | 100.0 /100 | #16 | Exceptional 94.5% |
| Luxembourgers | 100.0 /100 | #17 | Exceptional 94.5% |
| Maltese | 100.0 /100 | #18 | Exceptional 94.5% |
| Scandinavians | 100.0 /100 | #19 | Exceptional 94.5% |
| Italians | 100.0 /100 | #20 | Exceptional 94.5% |
| Tlingit-Haida | 100.0 /100 | #21 | Exceptional 94.4% |
| Tsimshian | 100.0 /100 | #22 | Exceptional 94.4% |
| Czechs | 100.0 /100 | #23 | Exceptional 94.4% |