Immigrants from Burma/Myanmar vs Immigrants from Morocco 11th Grade
COMPARE
Immigrants from Burma/Myanmar
Immigrants from Morocco
11th Grade
11th Grade Comparison
Immigrants from Burma/Myanmar
Immigrants from Morocco
90.4%
11TH GRADE
0.0/ 100
METRIC RATING
285th/ 347
METRIC RANK
92.4%
11TH GRADE
38.6/ 100
METRIC RATING
182nd/ 347
METRIC RANK
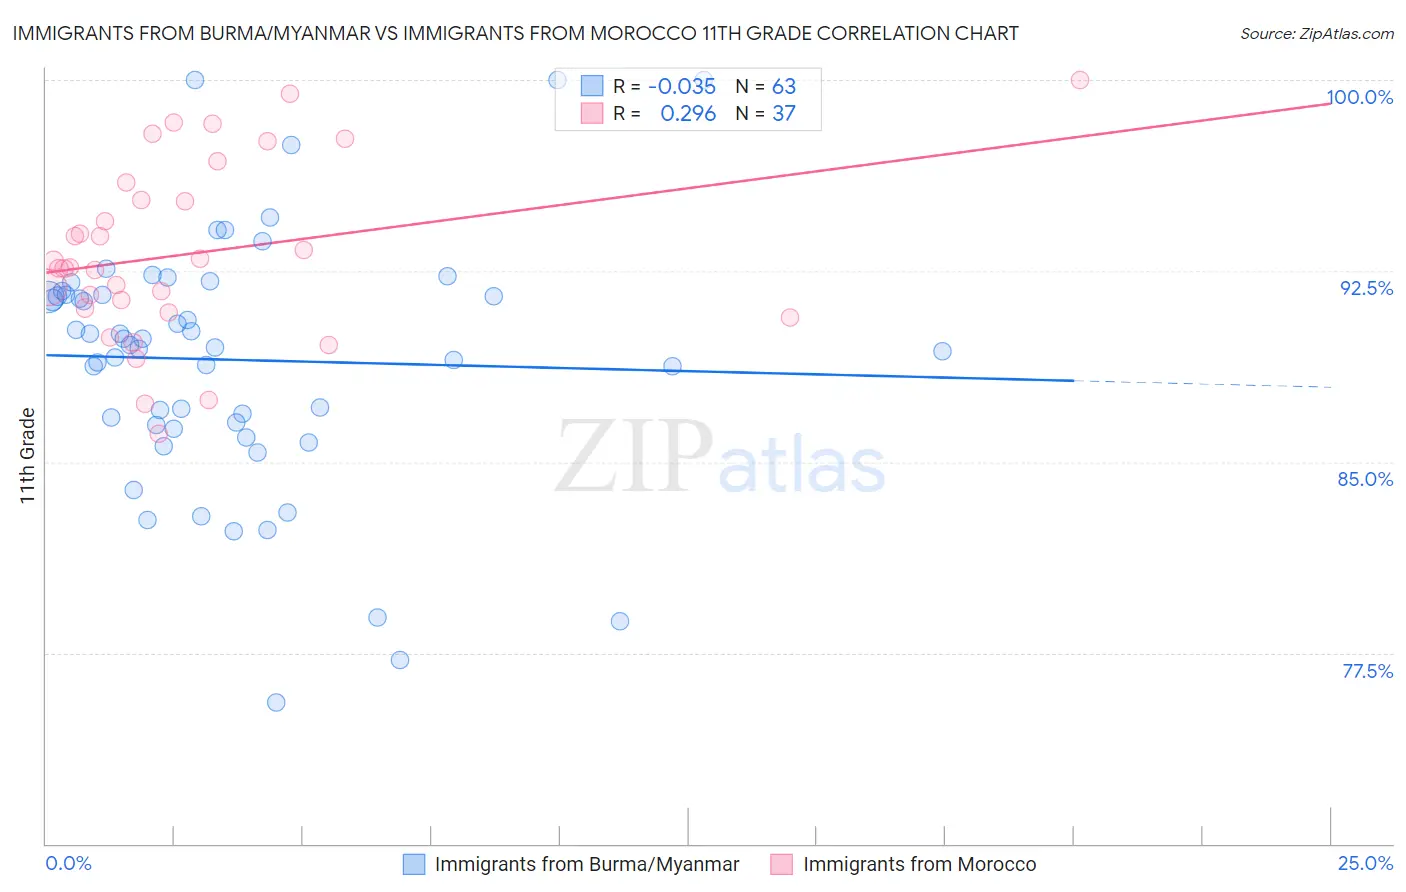
Immigrants from Burma/Myanmar vs Immigrants from Morocco 11th Grade Correlation Chart
The statistical analysis conducted on geographies consisting of 172,345,696 people shows no correlation between the proportion of Immigrants from Burma/Myanmar and percentage of population with at least 11th grade education in the United States with a correlation coefficient (R) of -0.035 and weighted average of 90.4%. Similarly, the statistical analysis conducted on geographies consisting of 178,912,438 people shows a weak positive correlation between the proportion of Immigrants from Morocco and percentage of population with at least 11th grade education in the United States with a correlation coefficient (R) of 0.296 and weighted average of 92.4%, a difference of 2.2%.
11th Grade Correlation Summary
| Measurement | Immigrants from Burma/Myanmar | Immigrants from Morocco |
| Minimum | 75.6% | 86.1% |
| Maximum | 100.0% | 100.0% |
| Range | 24.4% | 13.9% |
| Mean | 89.0% | 93.2% |
| Median | 89.6% | 92.6% |
| Interquartile 25% (IQ1) | 86.4% | 91.0% |
| Interquartile 75% (IQ3) | 91.6% | 95.6% |
| Interquartile Range (IQR) | 5.1% | 4.7% |
| Standard Deviation (Sample) | 4.9% | 3.5% |
| Standard Deviation (Population) | 4.9% | 3.4% |
Similar Demographics by 11th Grade
Demographics Similar to Immigrants from Burma/Myanmar by 11th Grade
In terms of 11th grade, the demographic groups most similar to Immigrants from Burma/Myanmar are Immigrants from West Indies (90.4%, a difference of 0.050%), Apache (90.4%, a difference of 0.060%), Pennsylvania German (90.3%, a difference of 0.080%), Immigrants from Laos (90.5%, a difference of 0.090%), and British West Indian (90.3%, a difference of 0.11%).
| Demographics | Rating | Rank | 11th Grade |
| Malaysians | 0.1 /100 | #278 | Tragic 90.8% |
| Barbadians | 0.0 /100 | #279 | Tragic 90.8% |
| Sri Lankans | 0.0 /100 | #280 | Tragic 90.7% |
| Dutch West Indians | 0.0 /100 | #281 | Tragic 90.7% |
| Immigrants | St. Vincent and the Grenadines | 0.0 /100 | #282 | Tragic 90.7% |
| Immigrants | Barbados | 0.0 /100 | #283 | Tragic 90.7% |
| Immigrants | Laos | 0.0 /100 | #284 | Tragic 90.5% |
| Immigrants | Burma/Myanmar | 0.0 /100 | #285 | Tragic 90.4% |
| Immigrants | West Indies | 0.0 /100 | #286 | Tragic 90.4% |
| Apache | 0.0 /100 | #287 | Tragic 90.4% |
| Pennsylvania Germans | 0.0 /100 | #288 | Tragic 90.3% |
| British West Indians | 0.0 /100 | #289 | Tragic 90.3% |
| Indonesians | 0.0 /100 | #290 | Tragic 90.3% |
| Haitians | 0.0 /100 | #291 | Tragic 90.3% |
| Cubans | 0.0 /100 | #292 | Tragic 90.2% |
Demographics Similar to Immigrants from Morocco by 11th Grade
In terms of 11th grade, the demographic groups most similar to Immigrants from Morocco are Immigrants from Malaysia (92.4%, a difference of 0.010%), Immigrants from Asia (92.4%, a difference of 0.010%), Creek (92.4%, a difference of 0.020%), Inupiat (92.4%, a difference of 0.020%), and Cherokee (92.4%, a difference of 0.020%).
| Demographics | Rating | Rank | 11th Grade |
| Shoshone | 48.9 /100 | #175 | Average 92.5% |
| Spaniards | 46.9 /100 | #176 | Average 92.5% |
| Guamanians/Chamorros | 45.0 /100 | #177 | Average 92.5% |
| Sudanese | 43.4 /100 | #178 | Average 92.5% |
| Creek | 40.9 /100 | #179 | Average 92.4% |
| Inupiat | 40.7 /100 | #180 | Average 92.4% |
| Cherokee | 40.7 /100 | #181 | Average 92.4% |
| Immigrants | Morocco | 38.6 /100 | #182 | Fair 92.4% |
| Immigrants | Malaysia | 37.6 /100 | #183 | Fair 92.4% |
| Immigrants | Asia | 37.4 /100 | #184 | Fair 92.4% |
| Immigrants | Nepal | 36.4 /100 | #185 | Fair 92.4% |
| Arapaho | 35.1 /100 | #186 | Fair 92.4% |
| Immigrants | Western Asia | 35.0 /100 | #187 | Fair 92.4% |
| Immigrants | Indonesia | 33.7 /100 | #188 | Fair 92.4% |
| Immigrants | Chile | 33.3 /100 | #189 | Fair 92.4% |