Immigrants from Burma/Myanmar vs Immigrants from Cuba 11th Grade
COMPARE
Immigrants from Burma/Myanmar
Immigrants from Cuba
11th Grade
11th Grade Comparison
Immigrants from Burma/Myanmar
Immigrants from Cuba
90.4%
11TH GRADE
0.0/ 100
METRIC RATING
285th/ 347
METRIC RANK
88.9%
11TH GRADE
0.0/ 100
METRIC RATING
316th/ 347
METRIC RANK
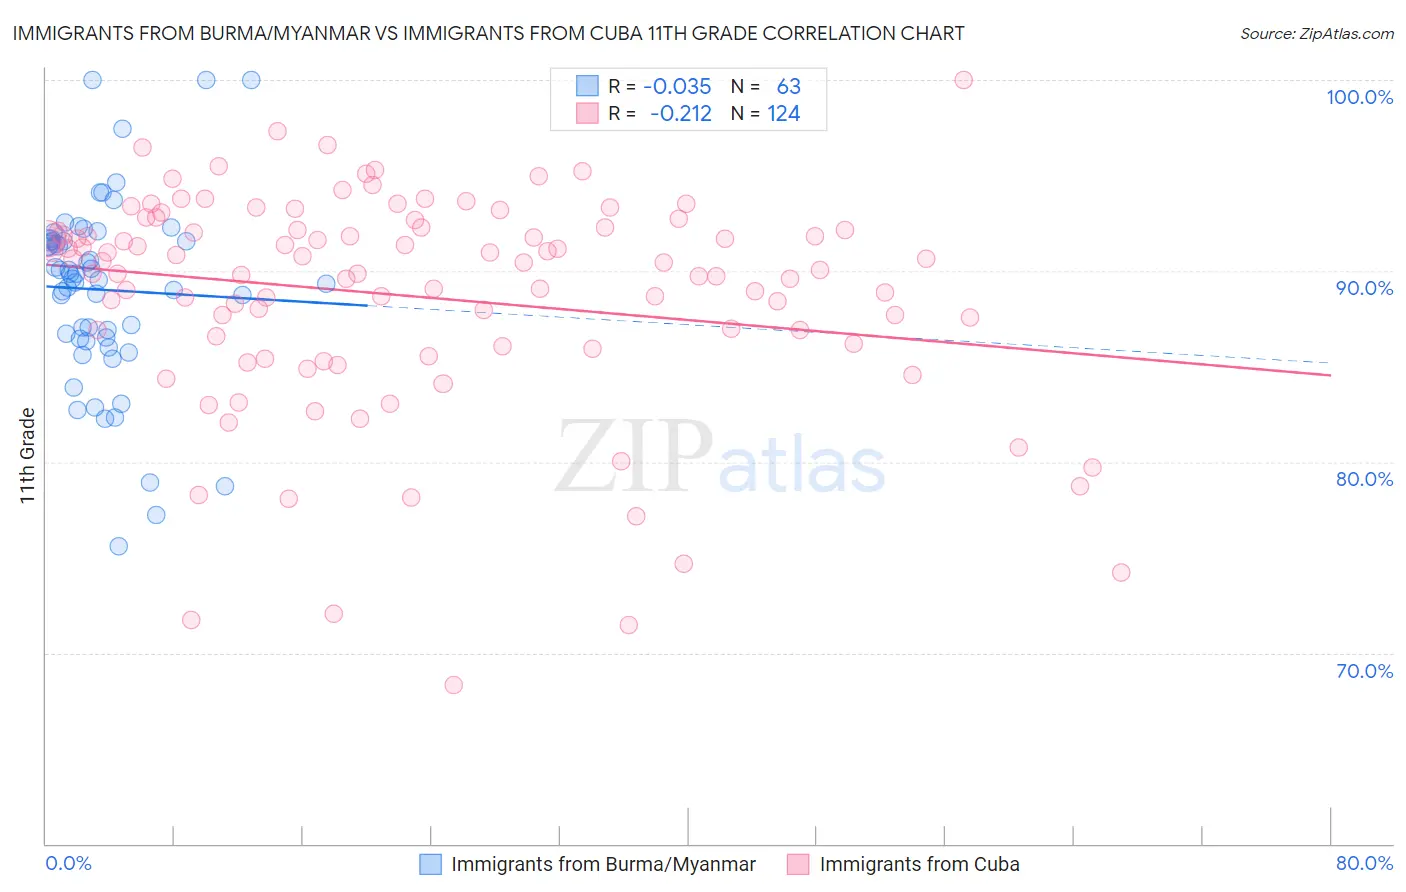
Immigrants from Burma/Myanmar vs Immigrants from Cuba 11th Grade Correlation Chart
The statistical analysis conducted on geographies consisting of 172,345,696 people shows no correlation between the proportion of Immigrants from Burma/Myanmar and percentage of population with at least 11th grade education in the United States with a correlation coefficient (R) of -0.035 and weighted average of 90.4%. Similarly, the statistical analysis conducted on geographies consisting of 326,028,015 people shows a weak negative correlation between the proportion of Immigrants from Cuba and percentage of population with at least 11th grade education in the United States with a correlation coefficient (R) of -0.212 and weighted average of 88.9%, a difference of 1.7%.
11th Grade Correlation Summary
| Measurement | Immigrants from Burma/Myanmar | Immigrants from Cuba |
| Minimum | 75.6% | 68.3% |
| Maximum | 100.0% | 100.0% |
| Range | 24.4% | 31.7% |
| Mean | 89.0% | 88.7% |
| Median | 89.6% | 90.2% |
| Interquartile 25% (IQ1) | 86.4% | 86.1% |
| Interquartile 75% (IQ3) | 91.6% | 92.2% |
| Interquartile Range (IQR) | 5.1% | 6.1% |
| Standard Deviation (Sample) | 4.9% | 5.8% |
| Standard Deviation (Population) | 4.9% | 5.8% |
Similar Demographics by 11th Grade
Demographics Similar to Immigrants from Burma/Myanmar by 11th Grade
In terms of 11th grade, the demographic groups most similar to Immigrants from Burma/Myanmar are Immigrants from West Indies (90.4%, a difference of 0.050%), Apache (90.4%, a difference of 0.060%), Pennsylvania German (90.3%, a difference of 0.080%), Immigrants from Laos (90.5%, a difference of 0.090%), and British West Indian (90.3%, a difference of 0.11%).
| Demographics | Rating | Rank | 11th Grade |
| Malaysians | 0.1 /100 | #278 | Tragic 90.8% |
| Barbadians | 0.0 /100 | #279 | Tragic 90.8% |
| Sri Lankans | 0.0 /100 | #280 | Tragic 90.7% |
| Dutch West Indians | 0.0 /100 | #281 | Tragic 90.7% |
| Immigrants | St. Vincent and the Grenadines | 0.0 /100 | #282 | Tragic 90.7% |
| Immigrants | Barbados | 0.0 /100 | #283 | Tragic 90.7% |
| Immigrants | Laos | 0.0 /100 | #284 | Tragic 90.5% |
| Immigrants | Burma/Myanmar | 0.0 /100 | #285 | Tragic 90.4% |
| Immigrants | West Indies | 0.0 /100 | #286 | Tragic 90.4% |
| Apache | 0.0 /100 | #287 | Tragic 90.4% |
| Pennsylvania Germans | 0.0 /100 | #288 | Tragic 90.3% |
| British West Indians | 0.0 /100 | #289 | Tragic 90.3% |
| Indonesians | 0.0 /100 | #290 | Tragic 90.3% |
| Haitians | 0.0 /100 | #291 | Tragic 90.3% |
| Cubans | 0.0 /100 | #292 | Tragic 90.2% |
Demographics Similar to Immigrants from Cuba by 11th Grade
In terms of 11th grade, the demographic groups most similar to Immigrants from Cuba are Lumbee (88.9%, a difference of 0.010%), Nicaraguan (88.9%, a difference of 0.070%), Immigrants from Ecuador (89.1%, a difference of 0.15%), Cape Verdean (89.1%, a difference of 0.16%), and Belizean (88.8%, a difference of 0.16%).
| Demographics | Rating | Rank | 11th Grade |
| Immigrants | Bangladesh | 0.0 /100 | #309 | Tragic 89.5% |
| Yaqui | 0.0 /100 | #310 | Tragic 89.5% |
| Vietnamese | 0.0 /100 | #311 | Tragic 89.4% |
| Immigrants | Portugal | 0.0 /100 | #312 | Tragic 89.3% |
| Immigrants | Caribbean | 0.0 /100 | #313 | Tragic 89.1% |
| Cape Verdeans | 0.0 /100 | #314 | Tragic 89.1% |
| Immigrants | Ecuador | 0.0 /100 | #315 | Tragic 89.1% |
| Immigrants | Cuba | 0.0 /100 | #316 | Tragic 88.9% |
| Lumbee | 0.0 /100 | #317 | Tragic 88.9% |
| Nicaraguans | 0.0 /100 | #318 | Tragic 88.9% |
| Belizeans | 0.0 /100 | #319 | Tragic 88.8% |
| Immigrants | Armenia | 0.0 /100 | #320 | Tragic 88.8% |
| Immigrants | Belize | 0.0 /100 | #321 | Tragic 88.7% |
| Puerto Ricans | 0.0 /100 | #322 | Tragic 88.4% |
| Pima | 0.0 /100 | #323 | Tragic 88.3% |