Immigrants from Liberia vs Serbian Bachelor's Degree
COMPARE
Immigrants from Liberia
Serbian
Bachelor's Degree
Bachelor's Degree Comparison
Immigrants from Liberia
Serbians
33.5%
BACHELOR'S DEGREE
0.9/ 100
METRIC RATING
249th/ 347
METRIC RANK
40.1%
BACHELOR'S DEGREE
92.4/ 100
METRIC RATING
129th/ 347
METRIC RANK
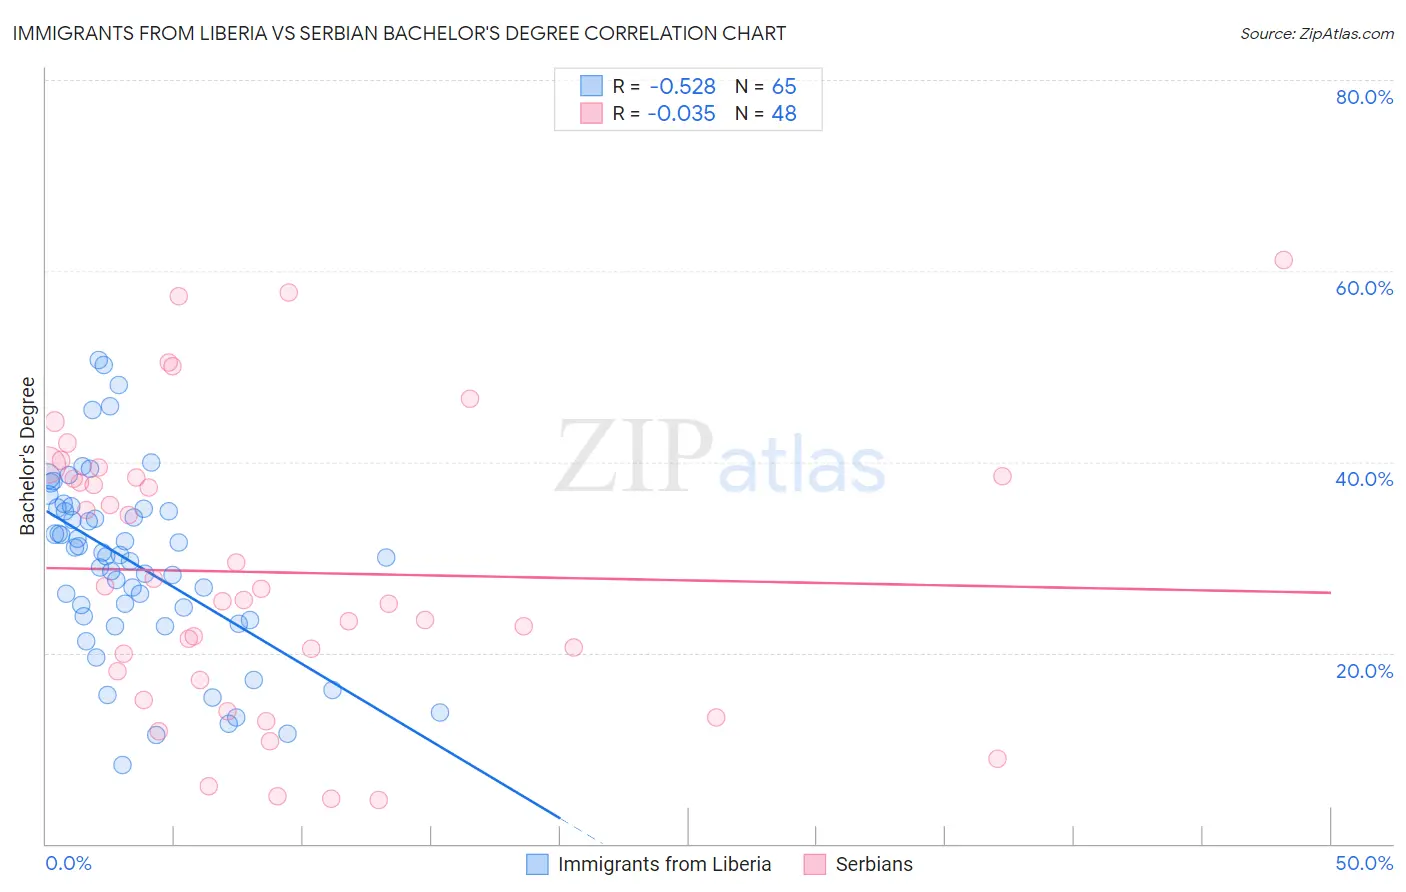
Immigrants from Liberia vs Serbian Bachelor's Degree Correlation Chart
The statistical analysis conducted on geographies consisting of 135,292,805 people shows a substantial negative correlation between the proportion of Immigrants from Liberia and percentage of population with at least bachelor's degree education in the United States with a correlation coefficient (R) of -0.528 and weighted average of 33.5%. Similarly, the statistical analysis conducted on geographies consisting of 267,632,791 people shows no correlation between the proportion of Serbians and percentage of population with at least bachelor's degree education in the United States with a correlation coefficient (R) of -0.035 and weighted average of 40.1%, a difference of 19.6%.
Bachelor's Degree Correlation Summary
| Measurement | Immigrants from Liberia | Serbian |
| Minimum | 8.2% | 4.6% |
| Maximum | 50.7% | 61.2% |
| Range | 42.4% | 56.6% |
| Mean | 29.4% | 28.4% |
| Median | 30.3% | 26.1% |
| Interquartile 25% (IQ1) | 23.6% | 17.6% |
| Interquartile 75% (IQ3) | 35.1% | 38.4% |
| Interquartile Range (IQR) | 11.5% | 20.8% |
| Standard Deviation (Sample) | 9.5% | 14.7% |
| Standard Deviation (Population) | 9.5% | 14.6% |
Similar Demographics by Bachelor's Degree
Demographics Similar to Immigrants from Liberia by Bachelor's Degree
In terms of bachelor's degree, the demographic groups most similar to Immigrants from Liberia are Indonesian (33.5%, a difference of 0.010%), Cree (33.6%, a difference of 0.13%), Immigrants from Congo (33.6%, a difference of 0.14%), Jamaican (33.6%, a difference of 0.23%), and Immigrants from Fiji (33.7%, a difference of 0.59%).
| Demographics | Rating | Rank | Bachelor's Degree |
| Immigrants | Nonimmigrants | 1.8 /100 | #242 | Tragic 34.2% |
| Immigrants | Guyana | 1.4 /100 | #243 | Tragic 33.9% |
| Delaware | 1.2 /100 | #244 | Tragic 33.8% |
| Immigrants | Fiji | 1.2 /100 | #245 | Tragic 33.7% |
| Jamaicans | 1.0 /100 | #246 | Tragic 33.6% |
| Immigrants | Congo | 1.0 /100 | #247 | Tragic 33.6% |
| Cree | 1.0 /100 | #248 | Tragic 33.6% |
| Immigrants | Liberia | 0.9 /100 | #249 | Tragic 33.5% |
| Indonesians | 0.9 /100 | #250 | Tragic 33.5% |
| Japanese | 0.7 /100 | #251 | Tragic 33.3% |
| Immigrants | Bahamas | 0.7 /100 | #252 | Tragic 33.3% |
| U.S. Virgin Islanders | 0.7 /100 | #253 | Tragic 33.2% |
| Native Hawaiians | 0.7 /100 | #254 | Tragic 33.2% |
| Iroquois | 0.7 /100 | #255 | Tragic 33.2% |
| Nicaraguans | 0.6 /100 | #256 | Tragic 33.1% |
Demographics Similar to Serbians by Bachelor's Degree
In terms of bachelor's degree, the demographic groups most similar to Serbians are Sierra Leonean (40.1%, a difference of 0.070%), Italian (40.1%, a difference of 0.15%), Immigrants from Venezuela (40.2%, a difference of 0.17%), Immigrants from Jordan (40.3%, a difference of 0.35%), and Taiwanese (40.0%, a difference of 0.40%).
| Demographics | Rating | Rank | Bachelor's Degree |
| Immigrants | Albania | 94.4 /100 | #122 | Exceptional 40.4% |
| Lebanese | 94.3 /100 | #123 | Exceptional 40.4% |
| Immigrants | Eritrea | 94.3 /100 | #124 | Exceptional 40.4% |
| British | 94.2 /100 | #125 | Exceptional 40.4% |
| Immigrants | Eastern Africa | 94.1 /100 | #126 | Exceptional 40.4% |
| Immigrants | Jordan | 93.4 /100 | #127 | Exceptional 40.3% |
| Immigrants | Venezuela | 92.9 /100 | #128 | Exceptional 40.2% |
| Serbians | 92.4 /100 | #129 | Exceptional 40.1% |
| Sierra Leoneans | 92.2 /100 | #130 | Exceptional 40.1% |
| Italians | 91.9 /100 | #131 | Exceptional 40.1% |
| Taiwanese | 91.1 /100 | #132 | Exceptional 40.0% |
| Immigrants | Southern Europe | 91.1 /100 | #133 | Exceptional 40.0% |
| Assyrians/Chaldeans/Syriacs | 89.4 /100 | #134 | Excellent 39.8% |
| Luxembourgers | 89.1 /100 | #135 | Excellent 39.8% |
| Pakistanis | 88.2 /100 | #136 | Excellent 39.7% |