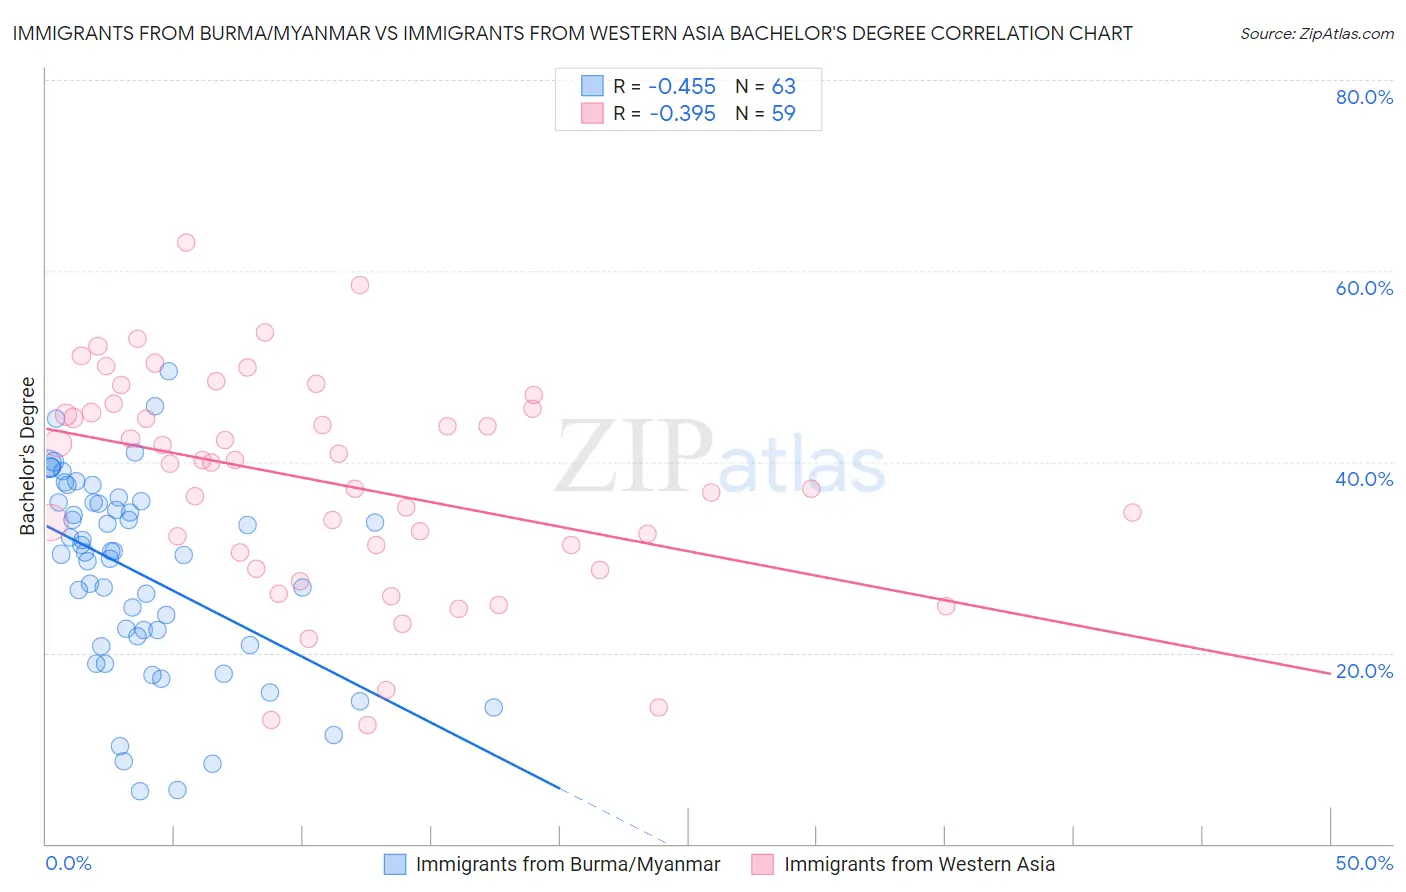
Immigrants from Burma/Myanmar vs Immigrants from Western Asia Bachelor's Degree
COMPARE
Immigrants from Burma/Myanmar
Immigrants from Western Asia
Bachelor's Degree
Bachelor's Degree Comparison
Immigrants from Burma/Myanmar
Immigrants from Western Asia
35.5%
BACHELOR'S DEGREE
7.3/ 100
METRIC RATING
225th/ 347
METRIC RANK
42.3%
BACHELOR'S DEGREE
99.2/ 100
METRIC RATING
84th/ 347
METRIC RANK
Immigrants from Burma/Myanmar vs Immigrants from Western Asia Bachelor's Degree Correlation Chart
The statistical analysis conducted on geographies consisting of 172,337,344 people shows a moderate negative correlation between the proportion of Immigrants from Burma/Myanmar and percentage of population with at least bachelor's degree education in the United States with a correlation coefficient (R) of -0.455 and weighted average of 35.5%. Similarly, the statistical analysis conducted on geographies consisting of 404,403,411 people shows a mild negative correlation between the proportion of Immigrants from Western Asia and percentage of population with at least bachelor's degree education in the United States with a correlation coefficient (R) of -0.395 and weighted average of 42.3%, a difference of 19.1%.
Bachelor's Degree Correlation Summary
| Measurement | Immigrants from Burma/Myanmar | Immigrants from Western Asia |
| Minimum | 5.5% | 12.5% |
| Maximum | 49.5% | 62.9% |
| Range | 44.0% | 50.4% |
| Mean | 28.4% | 37.8% |
| Median | 30.5% | 39.9% |
| Interquartile 25% (IQ1) | 20.8% | 30.5% |
| Interquartile 75% (IQ3) | 35.8% | 45.5% |
| Interquartile Range (IQR) | 15.0% | 15.0% |
| Standard Deviation (Sample) | 10.3% | 11.3% |
| Standard Deviation (Population) | 10.2% | 11.2% |
Similar Demographics by Bachelor's Degree
Demographics Similar to Immigrants from Burma/Myanmar by Bachelor's Degree
In terms of bachelor's degree, the demographic groups most similar to Immigrants from Burma/Myanmar are Portuguese (35.5%, a difference of 0.040%), Immigrants from Barbados (35.5%, a difference of 0.070%), Ecuadorian (35.4%, a difference of 0.30%), French Canadian (35.6%, a difference of 0.35%), and Trinidadian and Tobagonian (35.7%, a difference of 0.52%).
| Demographics | Rating | Rank | Bachelor's Degree |
| Sub-Saharan Africans | 9.8 /100 | #218 | Tragic 35.8% |
| West Indians | 9.7 /100 | #219 | Tragic 35.8% |
| Spanish | 9.6 /100 | #220 | Tragic 35.8% |
| Dutch | 9.2 /100 | #221 | Tragic 35.7% |
| Trinidadians and Tobagonians | 8.8 /100 | #222 | Tragic 35.7% |
| French Canadians | 8.3 /100 | #223 | Tragic 35.6% |
| Immigrants | Barbados | 7.5 /100 | #224 | Tragic 35.5% |
| Immigrants | Burma/Myanmar | 7.3 /100 | #225 | Tragic 35.5% |
| Portuguese | 7.2 /100 | #226 | Tragic 35.5% |
| Ecuadorians | 6.6 /100 | #227 | Tragic 35.4% |
| Immigrants | Trinidad and Tobago | 6.0 /100 | #228 | Tragic 35.3% |
| Whites/Caucasians | 5.9 /100 | #229 | Tragic 35.3% |
| Immigrants | Grenada | 4.3 /100 | #230 | Tragic 35.0% |
| Immigrants | St. Vincent and the Grenadines | 4.3 /100 | #231 | Tragic 35.0% |
| Hmong | 3.4 /100 | #232 | Tragic 34.8% |
Demographics Similar to Immigrants from Western Asia by Bachelor's Degree
In terms of bachelor's degree, the demographic groups most similar to Immigrants from Western Asia are Armenian (42.3%, a difference of 0.020%), Lithuanian (42.2%, a difference of 0.030%), Immigrants from Scotland (42.3%, a difference of 0.050%), Immigrants from Hungary (42.3%, a difference of 0.11%), and Immigrants from Brazil (42.2%, a difference of 0.11%).
| Demographics | Rating | Rank | Bachelor's Degree |
| Immigrants | Eastern Europe | 99.4 /100 | #77 | Exceptional 42.5% |
| Immigrants | Ethiopia | 99.4 /100 | #78 | Exceptional 42.5% |
| Immigrants | Lebanon | 99.3 /100 | #79 | Exceptional 42.4% |
| Immigrants | Croatia | 99.2 /100 | #80 | Exceptional 42.3% |
| Immigrants | Hungary | 99.2 /100 | #81 | Exceptional 42.3% |
| Immigrants | Scotland | 99.2 /100 | #82 | Exceptional 42.3% |
| Armenians | 99.2 /100 | #83 | Exceptional 42.3% |
| Immigrants | Western Asia | 99.2 /100 | #84 | Exceptional 42.3% |
| Lithuanians | 99.2 /100 | #85 | Exceptional 42.2% |
| Immigrants | Brazil | 99.2 /100 | #86 | Exceptional 42.2% |
| Carpatho Rusyns | 99.0 /100 | #87 | Exceptional 42.1% |
| Immigrants | Western Europe | 99.0 /100 | #88 | Exceptional 42.0% |
| Greeks | 99.0 /100 | #89 | Exceptional 42.0% |
| Laotians | 98.9 /100 | #90 | Exceptional 42.0% |
| Immigrants | Northern Africa | 98.9 /100 | #91 | Exceptional 41.9% |