Immigrants from Burma/Myanmar vs British Bachelor's Degree
COMPARE
Immigrants from Burma/Myanmar
British
Bachelor's Degree
Bachelor's Degree Comparison
Immigrants from Burma/Myanmar
British
35.5%
BACHELOR'S DEGREE
7.3/ 100
METRIC RATING
225th/ 347
METRIC RANK
40.4%
BACHELOR'S DEGREE
94.2/ 100
METRIC RATING
125th/ 347
METRIC RANK
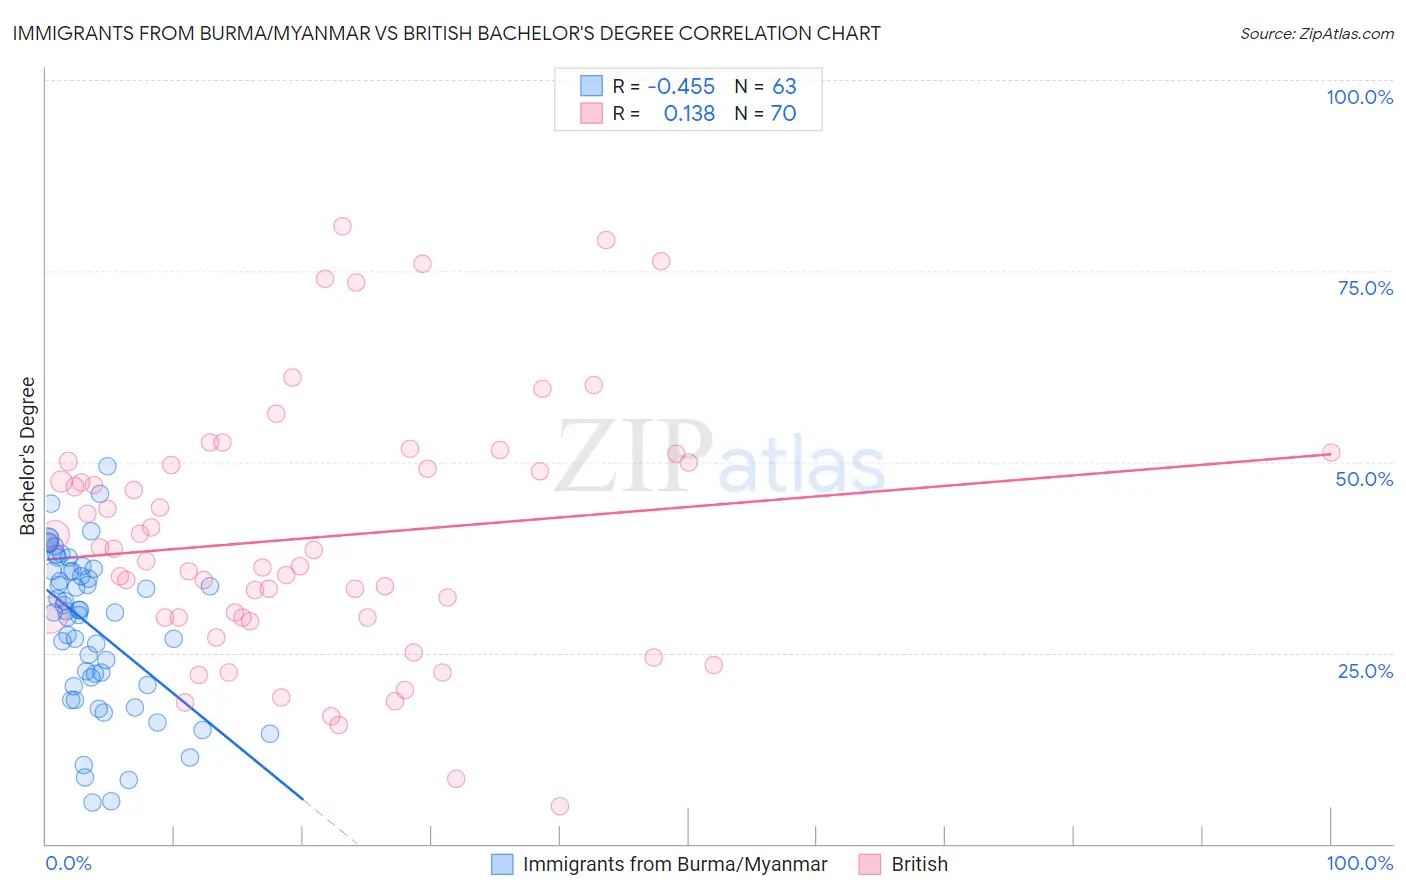
Immigrants from Burma/Myanmar vs British Bachelor's Degree Correlation Chart
The statistical analysis conducted on geographies consisting of 172,337,344 people shows a moderate negative correlation between the proportion of Immigrants from Burma/Myanmar and percentage of population with at least bachelor's degree education in the United States with a correlation coefficient (R) of -0.455 and weighted average of 35.5%. Similarly, the statistical analysis conducted on geographies consisting of 531,374,091 people shows a poor positive correlation between the proportion of British and percentage of population with at least bachelor's degree education in the United States with a correlation coefficient (R) of 0.138 and weighted average of 40.4%, a difference of 13.8%.
Bachelor's Degree Correlation Summary
| Measurement | Immigrants from Burma/Myanmar | British |
| Minimum | 5.5% | 5.0% |
| Maximum | 49.5% | 80.9% |
| Range | 44.0% | 76.0% |
| Mean | 28.4% | 40.1% |
| Median | 30.5% | 37.7% |
| Interquartile 25% (IQ1) | 20.8% | 29.6% |
| Interquartile 75% (IQ3) | 35.8% | 50.0% |
| Interquartile Range (IQR) | 15.0% | 20.4% |
| Standard Deviation (Sample) | 10.3% | 16.7% |
| Standard Deviation (Population) | 10.2% | 16.6% |
Similar Demographics by Bachelor's Degree
Demographics Similar to Immigrants from Burma/Myanmar by Bachelor's Degree
In terms of bachelor's degree, the demographic groups most similar to Immigrants from Burma/Myanmar are Portuguese (35.5%, a difference of 0.040%), Immigrants from Barbados (35.5%, a difference of 0.070%), Ecuadorian (35.4%, a difference of 0.30%), French Canadian (35.6%, a difference of 0.35%), and Trinidadian and Tobagonian (35.7%, a difference of 0.52%).
| Demographics | Rating | Rank | Bachelor's Degree |
| Sub-Saharan Africans | 9.8 /100 | #218 | Tragic 35.8% |
| West Indians | 9.7 /100 | #219 | Tragic 35.8% |
| Spanish | 9.6 /100 | #220 | Tragic 35.8% |
| Dutch | 9.2 /100 | #221 | Tragic 35.7% |
| Trinidadians and Tobagonians | 8.8 /100 | #222 | Tragic 35.7% |
| French Canadians | 8.3 /100 | #223 | Tragic 35.6% |
| Immigrants | Barbados | 7.5 /100 | #224 | Tragic 35.5% |
| Immigrants | Burma/Myanmar | 7.3 /100 | #225 | Tragic 35.5% |
| Portuguese | 7.2 /100 | #226 | Tragic 35.5% |
| Ecuadorians | 6.6 /100 | #227 | Tragic 35.4% |
| Immigrants | Trinidad and Tobago | 6.0 /100 | #228 | Tragic 35.3% |
| Whites/Caucasians | 5.9 /100 | #229 | Tragic 35.3% |
| Immigrants | Grenada | 4.3 /100 | #230 | Tragic 35.0% |
| Immigrants | St. Vincent and the Grenadines | 4.3 /100 | #231 | Tragic 35.0% |
| Hmong | 3.4 /100 | #232 | Tragic 34.8% |
Demographics Similar to British by Bachelor's Degree
In terms of bachelor's degree, the demographic groups most similar to British are Immigrants from Eritrea (40.4%, a difference of 0.030%), Lebanese (40.4%, a difference of 0.040%), Immigrants from Eastern Africa (40.4%, a difference of 0.050%), Immigrants from Albania (40.4%, a difference of 0.060%), and Moroccan (40.5%, a difference of 0.16%).
| Demographics | Rating | Rank | Bachelor's Degree |
| Croatians | 95.5 /100 | #118 | Exceptional 40.6% |
| Immigrants | Syria | 94.9 /100 | #119 | Exceptional 40.5% |
| Venezuelans | 94.7 /100 | #120 | Exceptional 40.5% |
| Moroccans | 94.6 /100 | #121 | Exceptional 40.5% |
| Immigrants | Albania | 94.4 /100 | #122 | Exceptional 40.4% |
| Lebanese | 94.3 /100 | #123 | Exceptional 40.4% |
| Immigrants | Eritrea | 94.3 /100 | #124 | Exceptional 40.4% |
| British | 94.2 /100 | #125 | Exceptional 40.4% |
| Immigrants | Eastern Africa | 94.1 /100 | #126 | Exceptional 40.4% |
| Immigrants | Jordan | 93.4 /100 | #127 | Exceptional 40.3% |
| Immigrants | Venezuela | 92.9 /100 | #128 | Exceptional 40.2% |
| Serbians | 92.4 /100 | #129 | Exceptional 40.1% |
| Sierra Leoneans | 92.2 /100 | #130 | Exceptional 40.1% |
| Italians | 91.9 /100 | #131 | Exceptional 40.1% |
| Taiwanese | 91.1 /100 | #132 | Exceptional 40.0% |