Colombian vs Serbian Bachelor's Degree
COMPARE
Colombian
Serbian
Bachelor's Degree
Bachelor's Degree Comparison
Colombians
Serbians
38.4%
BACHELOR'S DEGREE
65.0/ 100
METRIC RATING
162nd/ 347
METRIC RANK
40.1%
BACHELOR'S DEGREE
92.4/ 100
METRIC RATING
129th/ 347
METRIC RANK
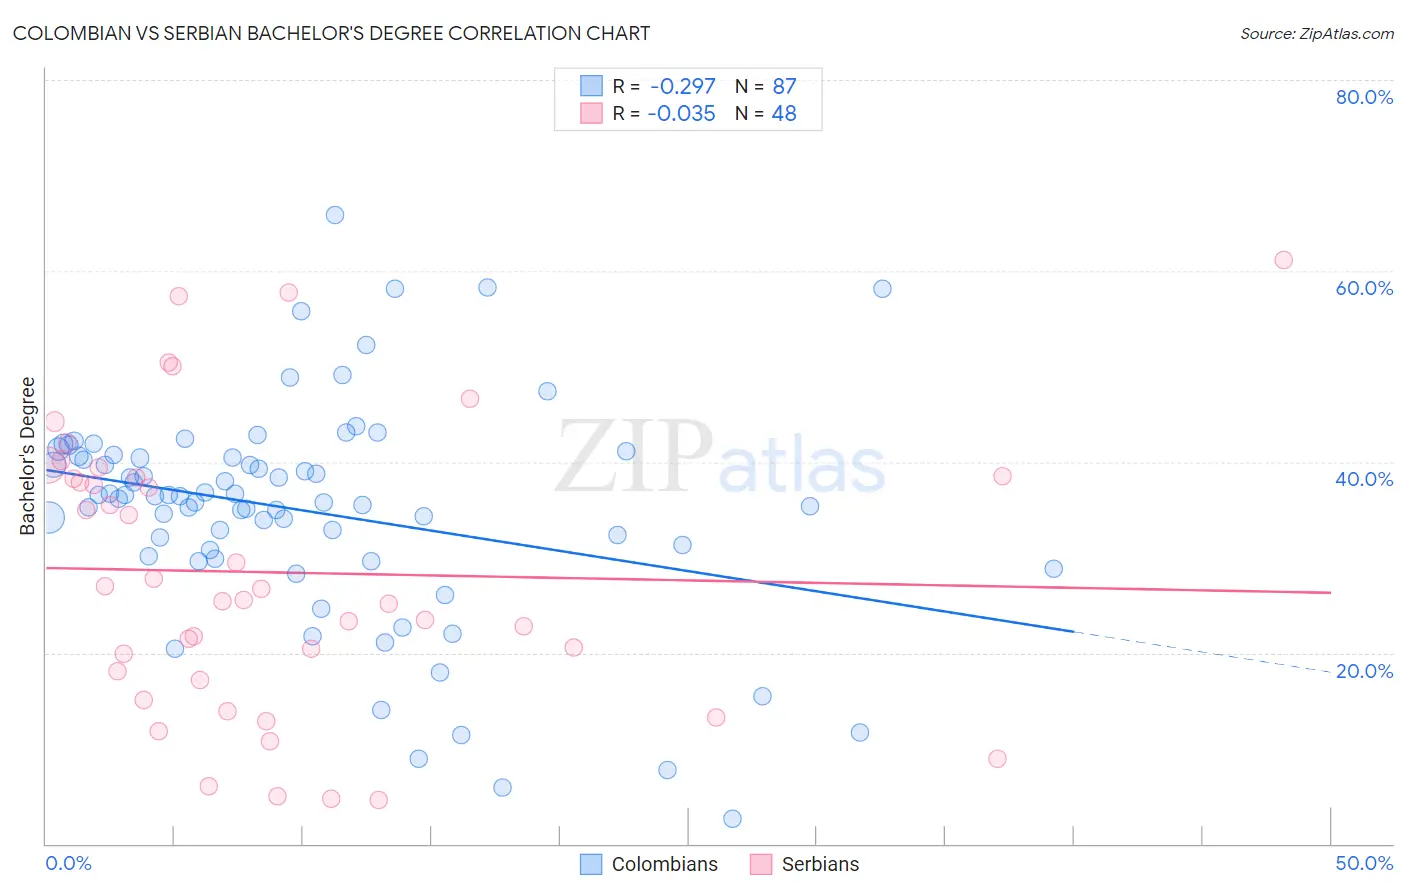
Colombian vs Serbian Bachelor's Degree Correlation Chart
The statistical analysis conducted on geographies consisting of 419,636,892 people shows a weak negative correlation between the proportion of Colombians and percentage of population with at least bachelor's degree education in the United States with a correlation coefficient (R) of -0.297 and weighted average of 38.4%. Similarly, the statistical analysis conducted on geographies consisting of 267,632,791 people shows no correlation between the proportion of Serbians and percentage of population with at least bachelor's degree education in the United States with a correlation coefficient (R) of -0.035 and weighted average of 40.1%, a difference of 4.5%.
Bachelor's Degree Correlation Summary
| Measurement | Colombian | Serbian |
| Minimum | 2.6% | 4.6% |
| Maximum | 65.8% | 61.2% |
| Range | 63.3% | 56.6% |
| Mean | 34.8% | 28.4% |
| Median | 36.4% | 26.1% |
| Interquartile 25% (IQ1) | 30.1% | 17.6% |
| Interquartile 75% (IQ3) | 40.6% | 38.4% |
| Interquartile Range (IQR) | 10.5% | 20.8% |
| Standard Deviation (Sample) | 11.6% | 14.7% |
| Standard Deviation (Population) | 11.6% | 14.6% |
Similar Demographics by Bachelor's Degree
Demographics Similar to Colombians by Bachelor's Degree
In terms of bachelor's degree, the demographic groups most similar to Colombians are Uruguayan (38.4%, a difference of 0.080%), Vietnamese (38.5%, a difference of 0.16%), Chinese (38.5%, a difference of 0.17%), Peruvian (38.3%, a difference of 0.17%), and Hungarian (38.3%, a difference of 0.31%).
| Demographics | Rating | Rank | Bachelor's Degree |
| Immigrants | Kenya | 73.8 /100 | #155 | Good 38.8% |
| Kenyans | 72.5 /100 | #156 | Good 38.7% |
| Immigrants | South America | 70.1 /100 | #157 | Good 38.6% |
| Immigrants | Germany | 69.6 /100 | #158 | Good 38.6% |
| Chinese | 66.6 /100 | #159 | Good 38.5% |
| Vietnamese | 66.6 /100 | #160 | Good 38.5% |
| Uruguayans | 65.8 /100 | #161 | Good 38.4% |
| Colombians | 65.0 /100 | #162 | Good 38.4% |
| Peruvians | 63.4 /100 | #163 | Good 38.3% |
| Hungarians | 62.1 /100 | #164 | Good 38.3% |
| Sri Lankans | 59.1 /100 | #165 | Average 38.2% |
| Somalis | 58.6 /100 | #166 | Average 38.1% |
| Scottish | 56.6 /100 | #167 | Average 38.1% |
| Danes | 56.2 /100 | #168 | Average 38.1% |
| Ghanaians | 55.3 /100 | #169 | Average 38.0% |
Demographics Similar to Serbians by Bachelor's Degree
In terms of bachelor's degree, the demographic groups most similar to Serbians are Sierra Leonean (40.1%, a difference of 0.070%), Italian (40.1%, a difference of 0.15%), Immigrants from Venezuela (40.2%, a difference of 0.17%), Immigrants from Jordan (40.3%, a difference of 0.35%), and Taiwanese (40.0%, a difference of 0.40%).
| Demographics | Rating | Rank | Bachelor's Degree |
| Immigrants | Albania | 94.4 /100 | #122 | Exceptional 40.4% |
| Lebanese | 94.3 /100 | #123 | Exceptional 40.4% |
| Immigrants | Eritrea | 94.3 /100 | #124 | Exceptional 40.4% |
| British | 94.2 /100 | #125 | Exceptional 40.4% |
| Immigrants | Eastern Africa | 94.1 /100 | #126 | Exceptional 40.4% |
| Immigrants | Jordan | 93.4 /100 | #127 | Exceptional 40.3% |
| Immigrants | Venezuela | 92.9 /100 | #128 | Exceptional 40.2% |
| Serbians | 92.4 /100 | #129 | Exceptional 40.1% |
| Sierra Leoneans | 92.2 /100 | #130 | Exceptional 40.1% |
| Italians | 91.9 /100 | #131 | Exceptional 40.1% |
| Taiwanese | 91.1 /100 | #132 | Exceptional 40.0% |
| Immigrants | Southern Europe | 91.1 /100 | #133 | Exceptional 40.0% |
| Assyrians/Chaldeans/Syriacs | 89.4 /100 | #134 | Excellent 39.8% |
| Luxembourgers | 89.1 /100 | #135 | Excellent 39.8% |
| Pakistanis | 88.2 /100 | #136 | Excellent 39.7% |