Tohono O'odham vs Immigrants from Switzerland 9th Grade
COMPARE
Tohono O'odham
Immigrants from Switzerland
9th Grade
9th Grade Comparison
Tohono O'odham
Immigrants from Switzerland
92.6%
9TH GRADE
0.0/ 100
METRIC RATING
304th/ 347
METRIC RANK
95.5%
9TH GRADE
97.7/ 100
METRIC RATING
102nd/ 347
METRIC RANK
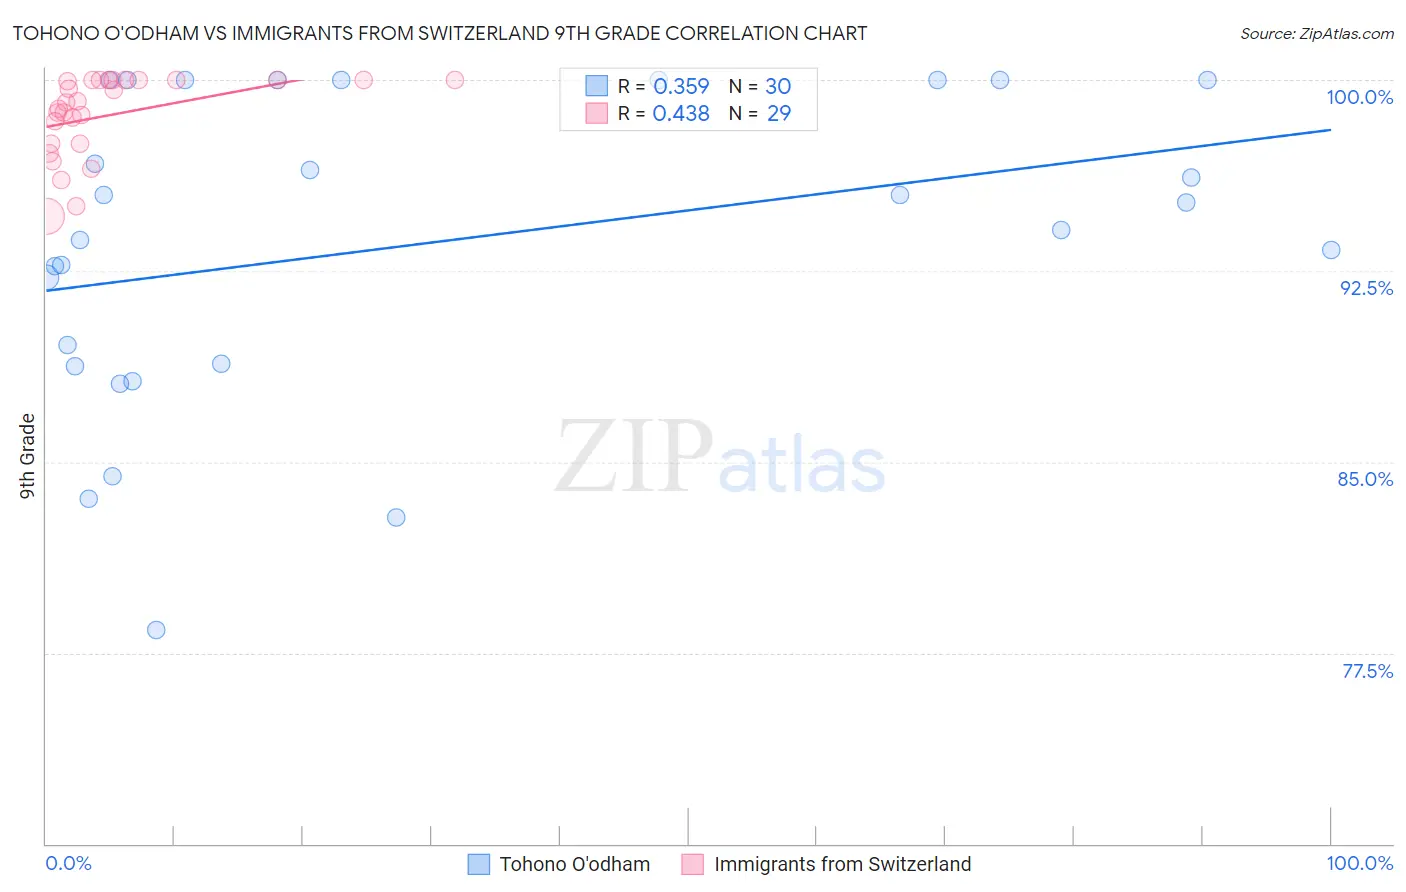
Tohono O'odham vs Immigrants from Switzerland 9th Grade Correlation Chart
The statistical analysis conducted on geographies consisting of 58,730,411 people shows a mild positive correlation between the proportion of Tohono O'odham and percentage of population with at least 9th grade education in the United States with a correlation coefficient (R) of 0.359 and weighted average of 92.6%. Similarly, the statistical analysis conducted on geographies consisting of 148,082,451 people shows a moderate positive correlation between the proportion of Immigrants from Switzerland and percentage of population with at least 9th grade education in the United States with a correlation coefficient (R) of 0.438 and weighted average of 95.5%, a difference of 3.1%.
9th Grade Correlation Summary
| Measurement | Tohono O'odham | Immigrants from Switzerland |
| Minimum | 78.4% | 94.6% |
| Maximum | 100.0% | 100.0% |
| Range | 21.6% | 5.4% |
| Mean | 93.6% | 98.6% |
| Median | 94.7% | 99.1% |
| Interquartile 25% (IQ1) | 88.8% | 97.5% |
| Interquartile 75% (IQ3) | 100.0% | 100.0% |
| Interquartile Range (IQR) | 11.2% | 2.5% |
| Standard Deviation (Sample) | 6.1% | 1.6% |
| Standard Deviation (Population) | 5.9% | 1.6% |
Similar Demographics by 9th Grade
Demographics Similar to Tohono O'odham by 9th Grade
In terms of 9th grade, the demographic groups most similar to Tohono O'odham are Guyanese (92.7%, a difference of 0.020%), Japanese (92.6%, a difference of 0.020%), Immigrants from Vietnam (92.6%, a difference of 0.020%), Immigrants from Dominica (92.7%, a difference of 0.040%), and Immigrants from Haiti (92.7%, a difference of 0.12%).
| Demographics | Rating | Rank | 9th Grade |
| Fijians | 0.0 /100 | #297 | Tragic 93.1% |
| Haitians | 0.0 /100 | #298 | Tragic 93.1% |
| Immigrants | Grenada | 0.0 /100 | #299 | Tragic 93.0% |
| Yaqui | 0.0 /100 | #300 | Tragic 92.9% |
| Immigrants | Haiti | 0.0 /100 | #301 | Tragic 92.7% |
| Immigrants | Dominica | 0.0 /100 | #302 | Tragic 92.7% |
| Guyanese | 0.0 /100 | #303 | Tragic 92.7% |
| Tohono O'odham | 0.0 /100 | #304 | Tragic 92.6% |
| Japanese | 0.0 /100 | #305 | Tragic 92.6% |
| Immigrants | Vietnam | 0.0 /100 | #306 | Tragic 92.6% |
| Immigrants | Immigrants | 0.0 /100 | #307 | Tragic 92.5% |
| Immigrants | Guyana | 0.0 /100 | #308 | Tragic 92.5% |
| Immigrants | Bangladesh | 0.0 /100 | #309 | Tragic 92.4% |
| Immigrants | Cambodia | 0.0 /100 | #310 | Tragic 92.4% |
| Immigrants | Fiji | 0.0 /100 | #311 | Tragic 92.3% |
Demographics Similar to Immigrants from Switzerland by 9th Grade
In terms of 9th grade, the demographic groups most similar to Immigrants from Switzerland are Potawatomi (95.5%, a difference of 0.0%), Immigrants from Moldova (95.5%, a difference of 0.010%), Syrian (95.5%, a difference of 0.030%), Immigrants from France (95.5%, a difference of 0.030%), and Lebanese (95.6%, a difference of 0.040%).
| Demographics | Rating | Rank | 9th Grade |
| Americans | 98.5 /100 | #95 | Exceptional 95.6% |
| Filipinos | 98.5 /100 | #96 | Exceptional 95.6% |
| Delaware | 98.4 /100 | #97 | Exceptional 95.6% |
| Immigrants | Japan | 98.4 /100 | #98 | Exceptional 95.6% |
| Menominee | 98.3 /100 | #99 | Exceptional 95.6% |
| Lebanese | 98.1 /100 | #100 | Exceptional 95.6% |
| Immigrants | Moldova | 97.9 /100 | #101 | Exceptional 95.5% |
| Immigrants | Switzerland | 97.7 /100 | #102 | Exceptional 95.5% |
| Potawatomi | 97.7 /100 | #103 | Exceptional 95.5% |
| Syrians | 97.4 /100 | #104 | Exceptional 95.5% |
| Immigrants | France | 97.4 /100 | #105 | Exceptional 95.5% |
| Immigrants | Norway | 97.1 /100 | #106 | Exceptional 95.5% |
| Immigrants | Zimbabwe | 96.9 /100 | #107 | Exceptional 95.5% |
| Chickasaw | 96.8 /100 | #108 | Exceptional 95.5% |
| Osage | 96.8 /100 | #109 | Exceptional 95.5% |