Immigrants from Burma/Myanmar vs Immigrants from Singapore 12th Grade, No Diploma
COMPARE
Immigrants from Burma/Myanmar
Immigrants from Singapore
12th Grade, No Diploma
12th Grade, No Diploma Comparison
Immigrants from Burma/Myanmar
Immigrants from Singapore
88.9%
12TH GRADE, NO DIPLOMA
0.0/ 100
METRIC RATING
280th/ 347
METRIC RANK
93.3%
12TH GRADE, NO DIPLOMA
99.9/ 100
METRIC RATING
18th/ 347
METRIC RANK
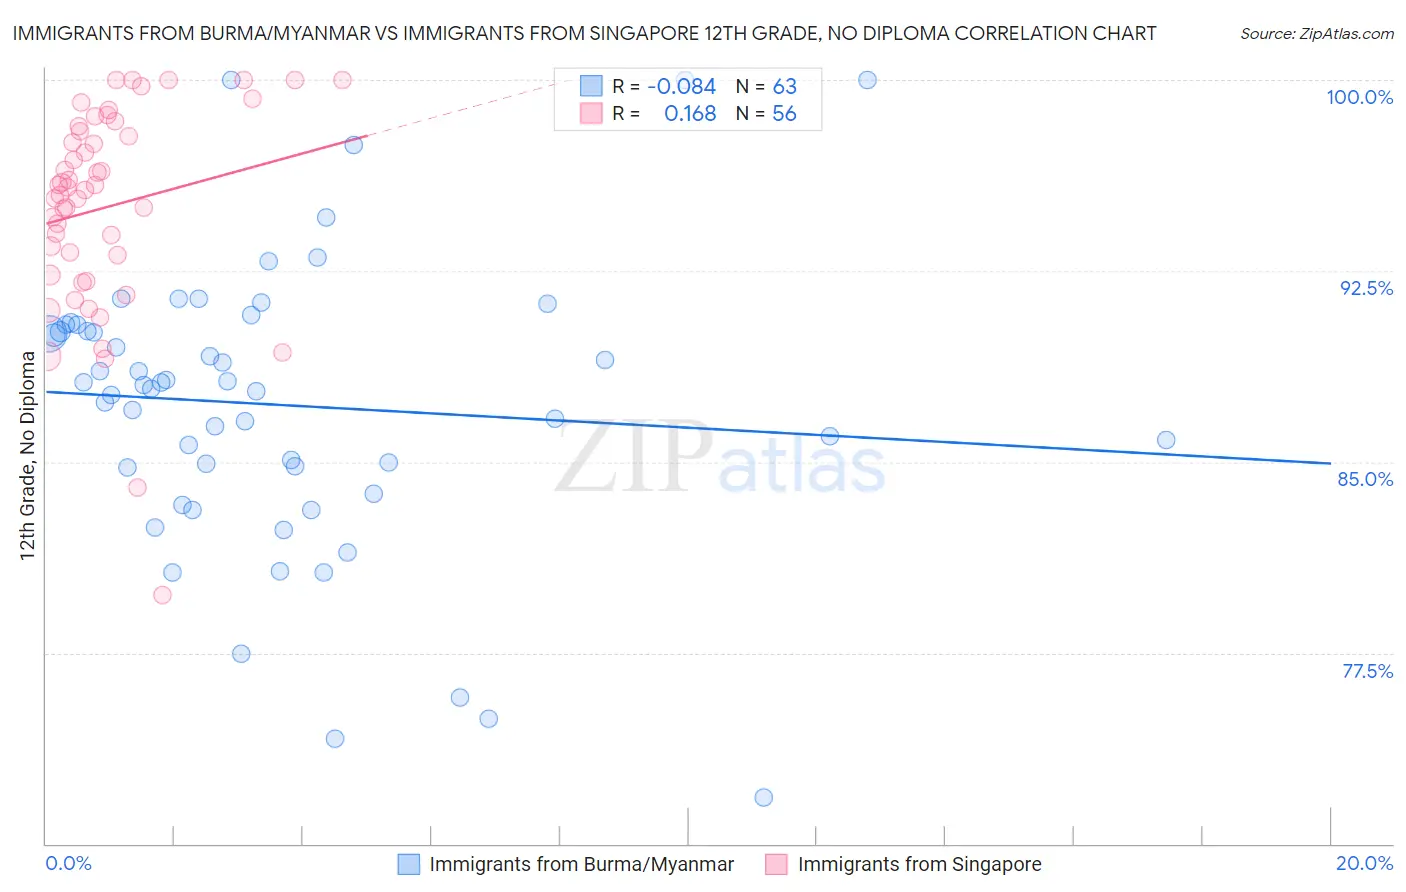
Immigrants from Burma/Myanmar vs Immigrants from Singapore 12th Grade, No Diploma Correlation Chart
The statistical analysis conducted on geographies consisting of 172,345,696 people shows a slight negative correlation between the proportion of Immigrants from Burma/Myanmar and percentage of population with at least 12th grade (no diploma) education in the United States with a correlation coefficient (R) of -0.084 and weighted average of 88.9%. Similarly, the statistical analysis conducted on geographies consisting of 137,521,094 people shows a poor positive correlation between the proportion of Immigrants from Singapore and percentage of population with at least 12th grade (no diploma) education in the United States with a correlation coefficient (R) of 0.168 and weighted average of 93.3%, a difference of 5.0%.
12th Grade, No Diploma Correlation Summary
| Measurement | Immigrants from Burma/Myanmar | Immigrants from Singapore |
| Minimum | 71.8% | 79.8% |
| Maximum | 100.0% | 100.0% |
| Range | 28.2% | 20.2% |
| Mean | 87.2% | 95.0% |
| Median | 88.0% | 95.7% |
| Interquartile 25% (IQ1) | 84.8% | 92.7% |
| Interquartile 75% (IQ3) | 90.4% | 98.1% |
| Interquartile Range (IQR) | 5.6% | 5.4% |
| Standard Deviation (Sample) | 5.7% | 4.1% |
| Standard Deviation (Population) | 5.6% | 4.0% |
Similar Demographics by 12th Grade, No Diploma
Demographics Similar to Immigrants from Burma/Myanmar by 12th Grade, No Diploma
In terms of 12th grade, no diploma, the demographic groups most similar to Immigrants from Burma/Myanmar are Immigrants from Laos (88.9%, a difference of 0.0%), Cuban (88.9%, a difference of 0.010%), Immigrants from St. Vincent and the Grenadines (88.9%, a difference of 0.070%), Immigrants from Barbados (89.0%, a difference of 0.13%), and Immigrants from Vietnam (88.7%, a difference of 0.18%).
| Demographics | Rating | Rank | 12th Grade, No Diploma |
| Barbadians | 0.1 /100 | #273 | Tragic 89.1% |
| Cajuns | 0.1 /100 | #274 | Tragic 89.1% |
| Immigrants | Congo | 0.1 /100 | #275 | Tragic 89.0% |
| Ute | 0.1 /100 | #276 | Tragic 89.0% |
| Immigrants | Barbados | 0.0 /100 | #277 | Tragic 89.0% |
| Immigrants | St. Vincent and the Grenadines | 0.0 /100 | #278 | Tragic 88.9% |
| Immigrants | Laos | 0.0 /100 | #279 | Tragic 88.9% |
| Immigrants | Burma/Myanmar | 0.0 /100 | #280 | Tragic 88.9% |
| Cubans | 0.0 /100 | #281 | Tragic 88.9% |
| Immigrants | Vietnam | 0.0 /100 | #282 | Tragic 88.7% |
| Paiute | 0.0 /100 | #283 | Tragic 88.7% |
| Pennsylvania Germans | 0.0 /100 | #284 | Tragic 88.7% |
| Indonesians | 0.0 /100 | #285 | Tragic 88.6% |
| Immigrants | West Indies | 0.0 /100 | #286 | Tragic 88.6% |
| Hopi | 0.0 /100 | #287 | Tragic 88.6% |
Demographics Similar to Immigrants from Singapore by 12th Grade, No Diploma
In terms of 12th grade, no diploma, the demographic groups most similar to Immigrants from Singapore are German (93.3%, a difference of 0.020%), Luxembourger (93.3%, a difference of 0.030%), Maltese (93.3%, a difference of 0.050%), Filipino (93.2%, a difference of 0.050%), and Italian (93.2%, a difference of 0.070%).
| Demographics | Rating | Rank | 12th Grade, No Diploma |
| Poles | 100.0 /100 | #11 | Exceptional 93.5% |
| Eastern Europeans | 100.0 /100 | #12 | Exceptional 93.5% |
| Danes | 100.0 /100 | #13 | Exceptional 93.5% |
| Bulgarians | 100.0 /100 | #14 | Exceptional 93.5% |
| Finns | 100.0 /100 | #15 | Exceptional 93.4% |
| Maltese | 100.0 /100 | #16 | Exceptional 93.3% |
| Luxembourgers | 100.0 /100 | #17 | Exceptional 93.3% |
| Immigrants | Singapore | 99.9 /100 | #18 | Exceptional 93.3% |
| Germans | 99.9 /100 | #19 | Exceptional 93.3% |
| Filipinos | 99.9 /100 | #20 | Exceptional 93.2% |
| Italians | 99.9 /100 | #21 | Exceptional 93.2% |
| Estonians | 99.9 /100 | #22 | Exceptional 93.2% |
| Scandinavians | 99.9 /100 | #23 | Exceptional 93.2% |
| Thais | 99.9 /100 | #24 | Exceptional 93.2% |
| Czechs | 99.9 /100 | #25 | Exceptional 93.2% |