Immigrants from Burma/Myanmar vs Immigrants from Zimbabwe 12th Grade, No Diploma
COMPARE
Immigrants from Burma/Myanmar
Immigrants from Zimbabwe
12th Grade, No Diploma
12th Grade, No Diploma Comparison
Immigrants from Burma/Myanmar
Immigrants from Zimbabwe
88.9%
12TH GRADE, NO DIPLOMA
0.0/ 100
METRIC RATING
280th/ 347
METRIC RANK
92.1%
12TH GRADE, NO DIPLOMA
96.5/ 100
METRIC RATING
113th/ 347
METRIC RANK
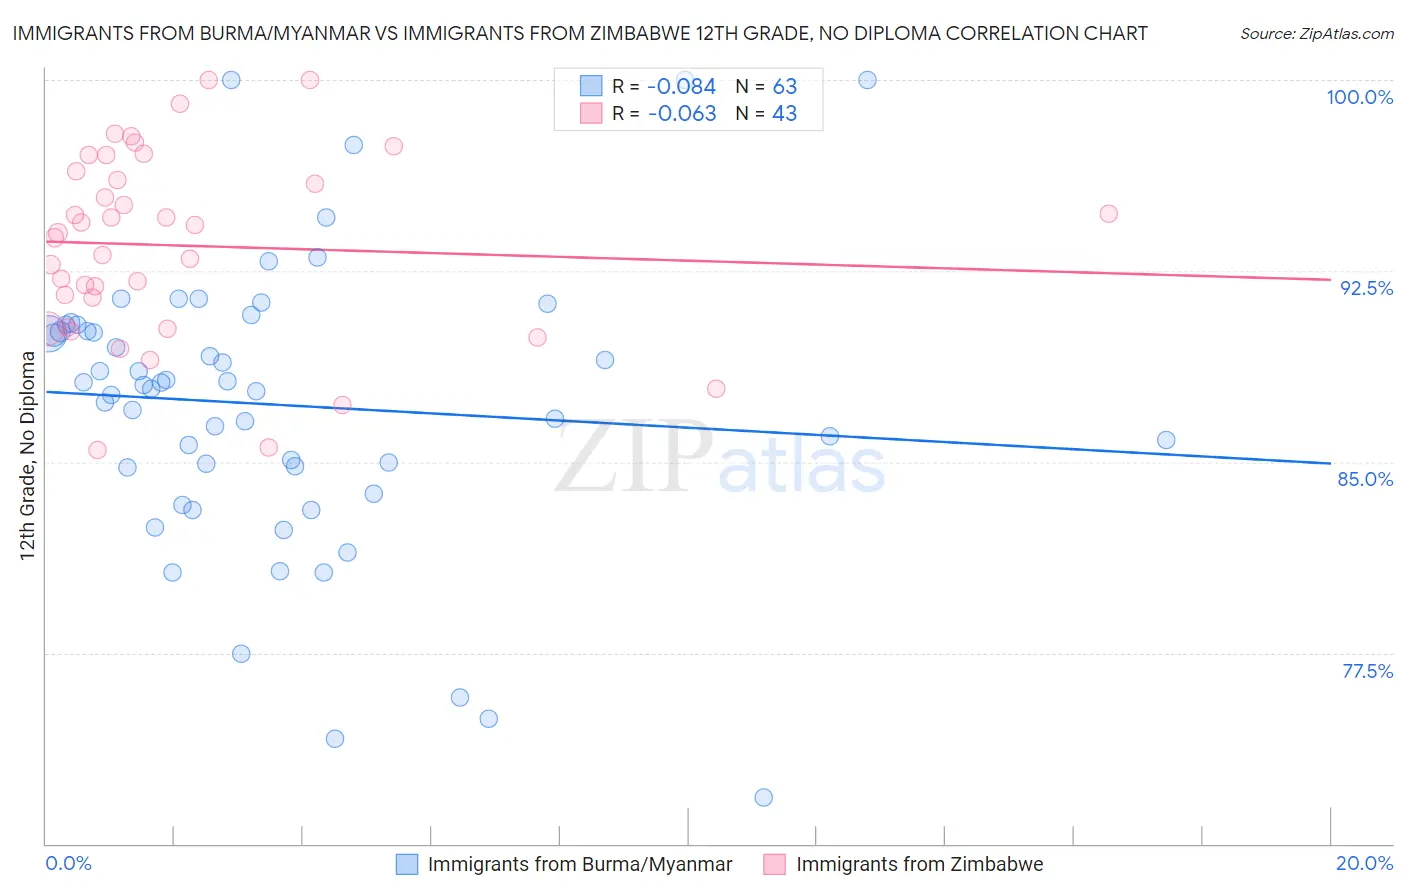
Immigrants from Burma/Myanmar vs Immigrants from Zimbabwe 12th Grade, No Diploma Correlation Chart
The statistical analysis conducted on geographies consisting of 172,345,696 people shows a slight negative correlation between the proportion of Immigrants from Burma/Myanmar and percentage of population with at least 12th grade (no diploma) education in the United States with a correlation coefficient (R) of -0.084 and weighted average of 88.9%. Similarly, the statistical analysis conducted on geographies consisting of 117,809,656 people shows a slight negative correlation between the proportion of Immigrants from Zimbabwe and percentage of population with at least 12th grade (no diploma) education in the United States with a correlation coefficient (R) of -0.063 and weighted average of 92.1%, a difference of 3.6%.
12th Grade, No Diploma Correlation Summary
| Measurement | Immigrants from Burma/Myanmar | Immigrants from Zimbabwe |
| Minimum | 71.8% | 85.5% |
| Maximum | 100.0% | 100.0% |
| Range | 28.2% | 14.5% |
| Mean | 87.2% | 93.5% |
| Median | 88.0% | 94.0% |
| Interquartile 25% (IQ1) | 84.8% | 90.3% |
| Interquartile 75% (IQ3) | 90.4% | 96.4% |
| Interquartile Range (IQR) | 5.6% | 6.1% |
| Standard Deviation (Sample) | 5.7% | 3.7% |
| Standard Deviation (Population) | 5.6% | 3.6% |
Similar Demographics by 12th Grade, No Diploma
Demographics Similar to Immigrants from Burma/Myanmar by 12th Grade, No Diploma
In terms of 12th grade, no diploma, the demographic groups most similar to Immigrants from Burma/Myanmar are Immigrants from Laos (88.9%, a difference of 0.0%), Cuban (88.9%, a difference of 0.010%), Immigrants from St. Vincent and the Grenadines (88.9%, a difference of 0.070%), Immigrants from Barbados (89.0%, a difference of 0.13%), and Immigrants from Vietnam (88.7%, a difference of 0.18%).
| Demographics | Rating | Rank | 12th Grade, No Diploma |
| Barbadians | 0.1 /100 | #273 | Tragic 89.1% |
| Cajuns | 0.1 /100 | #274 | Tragic 89.1% |
| Immigrants | Congo | 0.1 /100 | #275 | Tragic 89.0% |
| Ute | 0.1 /100 | #276 | Tragic 89.0% |
| Immigrants | Barbados | 0.0 /100 | #277 | Tragic 89.0% |
| Immigrants | St. Vincent and the Grenadines | 0.0 /100 | #278 | Tragic 88.9% |
| Immigrants | Laos | 0.0 /100 | #279 | Tragic 88.9% |
| Immigrants | Burma/Myanmar | 0.0 /100 | #280 | Tragic 88.9% |
| Cubans | 0.0 /100 | #281 | Tragic 88.9% |
| Immigrants | Vietnam | 0.0 /100 | #282 | Tragic 88.7% |
| Paiute | 0.0 /100 | #283 | Tragic 88.7% |
| Pennsylvania Germans | 0.0 /100 | #284 | Tragic 88.7% |
| Indonesians | 0.0 /100 | #285 | Tragic 88.6% |
| Immigrants | West Indies | 0.0 /100 | #286 | Tragic 88.6% |
| Hopi | 0.0 /100 | #287 | Tragic 88.6% |
Demographics Similar to Immigrants from Zimbabwe by 12th Grade, No Diploma
In terms of 12th grade, no diploma, the demographic groups most similar to Immigrants from Zimbabwe are Yugoslavian (92.1%, a difference of 0.0%), Immigrants from Sri Lanka (92.1%, a difference of 0.010%), Aleut (92.1%, a difference of 0.010%), Immigrants from Eastern Europe (92.1%, a difference of 0.020%), and Israeli (92.1%, a difference of 0.030%).
| Demographics | Rating | Rank | 12th Grade, No Diploma |
| Immigrants | Russia | 97.3 /100 | #106 | Exceptional 92.2% |
| Syrians | 97.2 /100 | #107 | Exceptional 92.2% |
| Jordanians | 97.2 /100 | #108 | Exceptional 92.2% |
| Immigrants | Hungary | 97.0 /100 | #109 | Exceptional 92.1% |
| Palestinians | 97.0 /100 | #110 | Exceptional 92.1% |
| Immigrants | Greece | 96.9 /100 | #111 | Exceptional 92.1% |
| Israelis | 96.8 /100 | #112 | Exceptional 92.1% |
| Immigrants | Zimbabwe | 96.5 /100 | #113 | Exceptional 92.1% |
| Yugoslavians | 96.5 /100 | #114 | Exceptional 92.1% |
| Immigrants | Sri Lanka | 96.4 /100 | #115 | Exceptional 92.1% |
| Aleuts | 96.3 /100 | #116 | Exceptional 92.1% |
| Immigrants | Eastern Europe | 96.3 /100 | #117 | Exceptional 92.1% |
| Puget Sound Salish | 95.8 /100 | #118 | Exceptional 92.0% |
| Immigrants | Germany | 95.5 /100 | #119 | Exceptional 92.0% |
| Immigrants | Kazakhstan | 94.2 /100 | #120 | Exceptional 91.9% |