Immigrants from Burma/Myanmar vs Chippewa 12th Grade, No Diploma
COMPARE
Immigrants from Burma/Myanmar
Chippewa
12th Grade, No Diploma
12th Grade, No Diploma Comparison
Immigrants from Burma/Myanmar
Chippewa
88.9%
12TH GRADE, NO DIPLOMA
0.0/ 100
METRIC RATING
280th/ 347
METRIC RANK
91.5%
12TH GRADE, NO DIPLOMA
78.8/ 100
METRIC RATING
151st/ 347
METRIC RANK
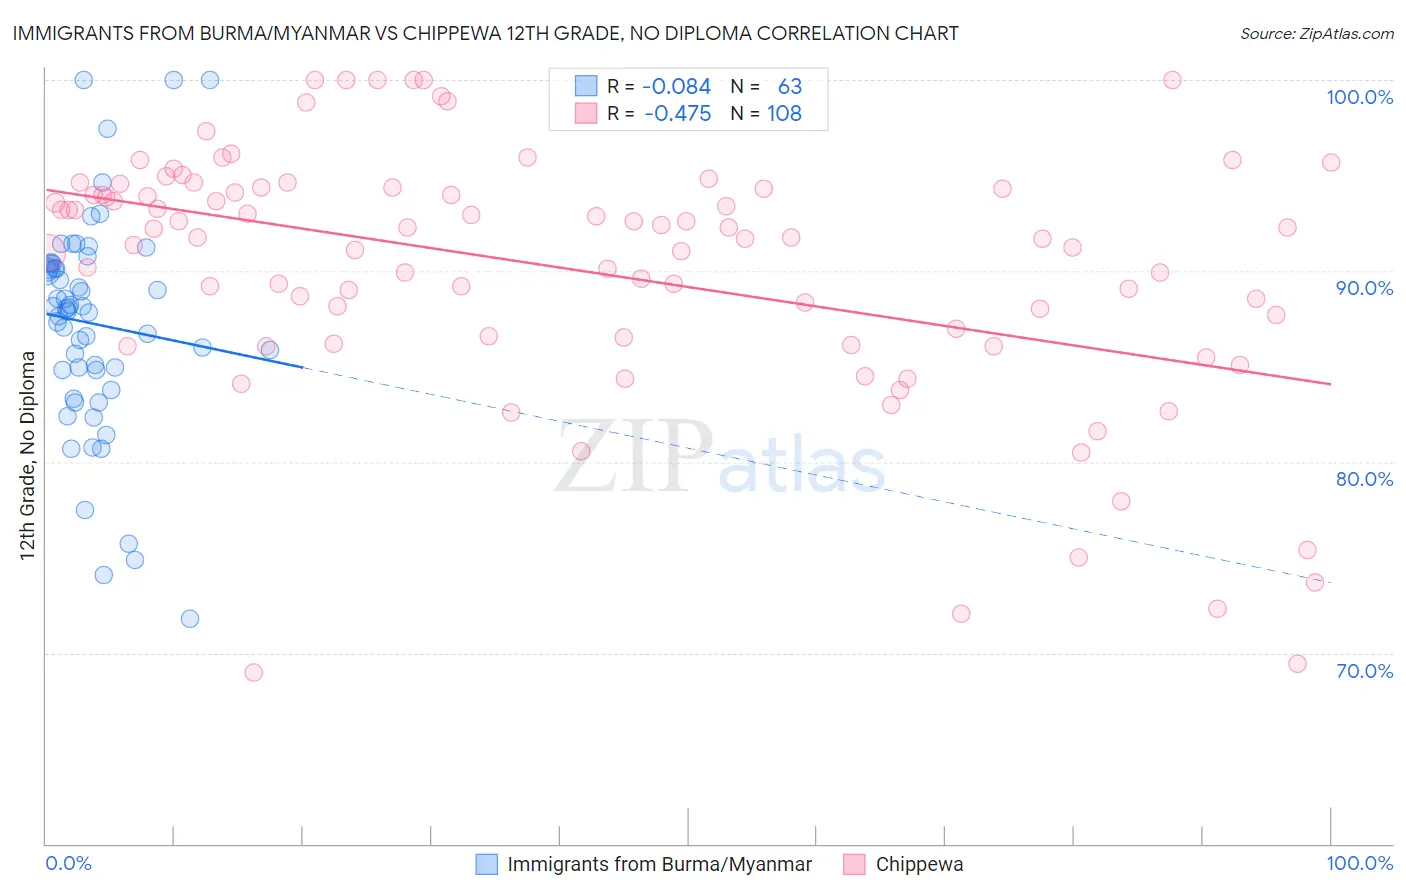
Immigrants from Burma/Myanmar vs Chippewa 12th Grade, No Diploma Correlation Chart
The statistical analysis conducted on geographies consisting of 172,345,696 people shows a slight negative correlation between the proportion of Immigrants from Burma/Myanmar and percentage of population with at least 12th grade (no diploma) education in the United States with a correlation coefficient (R) of -0.084 and weighted average of 88.9%. Similarly, the statistical analysis conducted on geographies consisting of 215,068,347 people shows a moderate negative correlation between the proportion of Chippewa and percentage of population with at least 12th grade (no diploma) education in the United States with a correlation coefficient (R) of -0.475 and weighted average of 91.5%, a difference of 3.0%.
12th Grade, No Diploma Correlation Summary
| Measurement | Immigrants from Burma/Myanmar | Chippewa |
| Minimum | 71.8% | 69.0% |
| Maximum | 100.0% | 100.0% |
| Range | 28.2% | 31.0% |
| Mean | 87.2% | 90.1% |
| Median | 88.0% | 91.8% |
| Interquartile 25% (IQ1) | 84.8% | 86.5% |
| Interquartile 75% (IQ3) | 90.4% | 94.3% |
| Interquartile Range (IQR) | 5.6% | 7.8% |
| Standard Deviation (Sample) | 5.7% | 6.7% |
| Standard Deviation (Population) | 5.6% | 6.6% |
Similar Demographics by 12th Grade, No Diploma
Demographics Similar to Immigrants from Burma/Myanmar by 12th Grade, No Diploma
In terms of 12th grade, no diploma, the demographic groups most similar to Immigrants from Burma/Myanmar are Immigrants from Laos (88.9%, a difference of 0.0%), Cuban (88.9%, a difference of 0.010%), Immigrants from St. Vincent and the Grenadines (88.9%, a difference of 0.070%), Immigrants from Barbados (89.0%, a difference of 0.13%), and Immigrants from Vietnam (88.7%, a difference of 0.18%).
| Demographics | Rating | Rank | 12th Grade, No Diploma |
| Barbadians | 0.1 /100 | #273 | Tragic 89.1% |
| Cajuns | 0.1 /100 | #274 | Tragic 89.1% |
| Immigrants | Congo | 0.1 /100 | #275 | Tragic 89.0% |
| Ute | 0.1 /100 | #276 | Tragic 89.0% |
| Immigrants | Barbados | 0.0 /100 | #277 | Tragic 89.0% |
| Immigrants | St. Vincent and the Grenadines | 0.0 /100 | #278 | Tragic 88.9% |
| Immigrants | Laos | 0.0 /100 | #279 | Tragic 88.9% |
| Immigrants | Burma/Myanmar | 0.0 /100 | #280 | Tragic 88.9% |
| Cubans | 0.0 /100 | #281 | Tragic 88.9% |
| Immigrants | Vietnam | 0.0 /100 | #282 | Tragic 88.7% |
| Paiute | 0.0 /100 | #283 | Tragic 88.7% |
| Pennsylvania Germans | 0.0 /100 | #284 | Tragic 88.7% |
| Indonesians | 0.0 /100 | #285 | Tragic 88.6% |
| Immigrants | West Indies | 0.0 /100 | #286 | Tragic 88.6% |
| Hopi | 0.0 /100 | #287 | Tragic 88.6% |
Demographics Similar to Chippewa by 12th Grade, No Diploma
In terms of 12th grade, no diploma, the demographic groups most similar to Chippewa are Ugandan (91.5%, a difference of 0.0%), Paraguayan (91.5%, a difference of 0.0%), Pakistani (91.5%, a difference of 0.010%), Indian (Asian) (91.5%, a difference of 0.010%), and Immigrants from Spain (91.6%, a difference of 0.020%).
| Demographics | Rating | Rank | 12th Grade, No Diploma |
| Immigrants | Spain | 80.1 /100 | #144 | Excellent 91.6% |
| Immigrants | Lebanon | 80.0 /100 | #145 | Excellent 91.6% |
| Immigrants | Brazil | 79.8 /100 | #146 | Good 91.5% |
| Pakistanis | 79.6 /100 | #147 | Good 91.5% |
| Indians (Asian) | 79.4 /100 | #148 | Good 91.5% |
| Ugandans | 79.0 /100 | #149 | Good 91.5% |
| Paraguayans | 78.9 /100 | #150 | Good 91.5% |
| Chippewa | 78.8 /100 | #151 | Good 91.5% |
| Kenyans | 77.4 /100 | #152 | Good 91.5% |
| Iraqis | 75.3 /100 | #153 | Good 91.5% |
| Immigrants | Kenya | 73.9 /100 | #154 | Good 91.5% |
| Immigrants | Iraq | 73.0 /100 | #155 | Good 91.4% |
| Asians | 71.9 /100 | #156 | Good 91.4% |
| Immigrants | Pakistan | 70.7 /100 | #157 | Good 91.4% |
| Immigrants | Northern Africa | 66.2 /100 | #158 | Good 91.4% |