Ottawa vs Immigrants from Ghana Bachelor's Degree
COMPARE
Ottawa
Immigrants from Ghana
Bachelor's Degree
Bachelor's Degree Comparison
Ottawa
Immigrants from Ghana
31.1%
BACHELOR'S DEGREE
0.1/ 100
METRIC RATING
287th/ 347
METRIC RANK
36.9%
BACHELOR'S DEGREE
27.4/ 100
METRIC RATING
200th/ 347
METRIC RANK
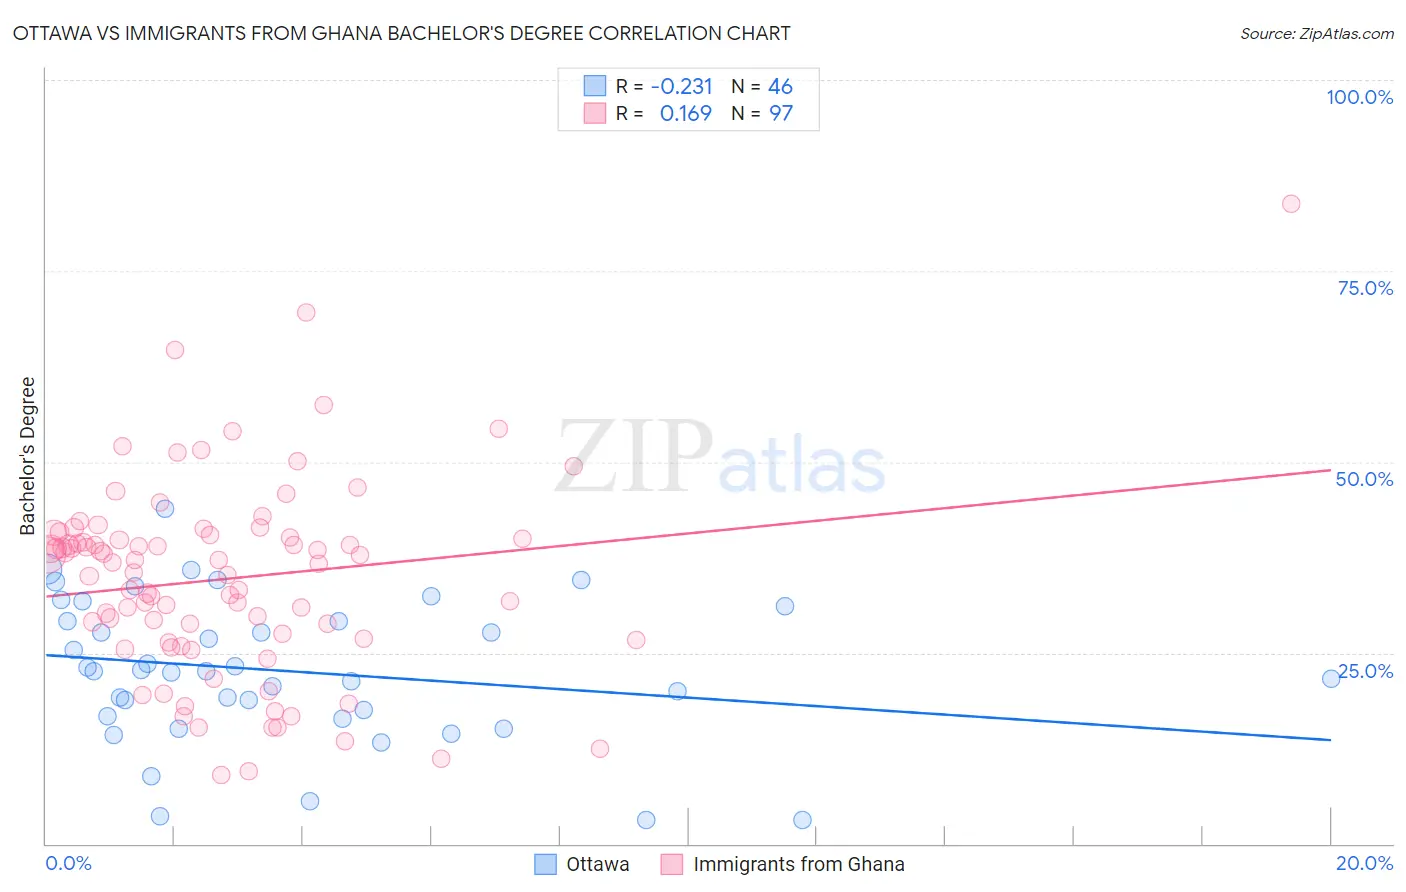
Ottawa vs Immigrants from Ghana Bachelor's Degree Correlation Chart
The statistical analysis conducted on geographies consisting of 49,955,025 people shows a weak negative correlation between the proportion of Ottawa and percentage of population with at least bachelor's degree education in the United States with a correlation coefficient (R) of -0.231 and weighted average of 31.1%. Similarly, the statistical analysis conducted on geographies consisting of 199,935,745 people shows a poor positive correlation between the proportion of Immigrants from Ghana and percentage of population with at least bachelor's degree education in the United States with a correlation coefficient (R) of 0.169 and weighted average of 36.9%, a difference of 18.7%.
Bachelor's Degree Correlation Summary
| Measurement | Ottawa | Immigrants from Ghana |
| Minimum | 3.0% | 9.1% |
| Maximum | 43.8% | 83.8% |
| Range | 40.8% | 74.7% |
| Mean | 22.6% | 34.7% |
| Median | 22.6% | 36.8% |
| Interquartile 25% (IQ1) | 16.7% | 26.7% |
| Interquartile 75% (IQ3) | 29.1% | 40.3% |
| Interquartile Range (IQR) | 12.4% | 13.5% |
| Standard Deviation (Sample) | 9.4% | 12.8% |
| Standard Deviation (Population) | 9.3% | 12.7% |
Similar Demographics by Bachelor's Degree
Demographics Similar to Ottawa by Bachelor's Degree
In terms of bachelor's degree, the demographic groups most similar to Ottawa are Guatemalan (31.0%, a difference of 0.36%), Puerto Rican (31.0%, a difference of 0.50%), Immigrants from Honduras (30.9%, a difference of 0.54%), Black/African American (30.9%, a difference of 0.58%), and Immigrants from El Salvador (31.3%, a difference of 0.62%).
| Demographics | Rating | Rank | Bachelor's Degree |
| Immigrants | Laos | 0.1 /100 | #280 | Tragic 31.6% |
| Blackfeet | 0.1 /100 | #281 | Tragic 31.5% |
| Immigrants | Caribbean | 0.1 /100 | #282 | Tragic 31.4% |
| Hondurans | 0.1 /100 | #283 | Tragic 31.3% |
| Haitians | 0.1 /100 | #284 | Tragic 31.3% |
| Aleuts | 0.1 /100 | #285 | Tragic 31.3% |
| Immigrants | El Salvador | 0.1 /100 | #286 | Tragic 31.3% |
| Ottawa | 0.1 /100 | #287 | Tragic 31.1% |
| Guatemalans | 0.1 /100 | #288 | Tragic 31.0% |
| Puerto Ricans | 0.1 /100 | #289 | Tragic 31.0% |
| Immigrants | Honduras | 0.1 /100 | #290 | Tragic 30.9% |
| Blacks/African Americans | 0.1 /100 | #291 | Tragic 30.9% |
| Ute | 0.1 /100 | #292 | Tragic 30.9% |
| Cape Verdeans | 0.1 /100 | #293 | Tragic 30.9% |
| Immigrants | Guatemala | 0.0 /100 | #294 | Tragic 30.8% |
Demographics Similar to Immigrants from Ghana by Bachelor's Degree
In terms of bachelor's degree, the demographic groups most similar to Immigrants from Ghana are Immigrants from Costa Rica (36.9%, a difference of 0.0%), Welsh (37.0%, a difference of 0.21%), Czechoslovakian (37.0%, a difference of 0.22%), Immigrants from South Eastern Asia (36.8%, a difference of 0.26%), and Celtic (37.0%, a difference of 0.27%).
| Demographics | Rating | Rank | Bachelor's Degree |
| Yugoslavians | 31.5 /100 | #193 | Fair 37.1% |
| Belgians | 29.9 /100 | #194 | Fair 37.0% |
| Koreans | 29.8 /100 | #195 | Fair 37.0% |
| Celtics | 29.5 /100 | #196 | Fair 37.0% |
| Czechoslovakians | 29.2 /100 | #197 | Fair 37.0% |
| Welsh | 29.1 /100 | #198 | Fair 37.0% |
| Immigrants | Costa Rica | 27.4 /100 | #199 | Fair 36.9% |
| Immigrants | Ghana | 27.4 /100 | #200 | Fair 36.9% |
| Immigrants | South Eastern Asia | 25.4 /100 | #201 | Fair 36.8% |
| Immigrants | Zaire | 25.3 /100 | #202 | Fair 36.8% |
| Immigrants | Nigeria | 23.1 /100 | #203 | Fair 36.7% |
| Immigrants | Immigrants | 22.8 /100 | #204 | Fair 36.7% |
| Finns | 22.2 /100 | #205 | Fair 36.7% |
| Spaniards | 21.2 /100 | #206 | Fair 36.6% |
| Immigrants | Middle Africa | 20.6 /100 | #207 | Fair 36.6% |