Colville vs Immigrants from Ghana Bachelor's Degree
COMPARE
Colville
Immigrants from Ghana
Bachelor's Degree
Bachelor's Degree Comparison
Colville
Immigrants from Ghana
29.0%
BACHELOR'S DEGREE
0.0/ 100
METRIC RATING
317th/ 347
METRIC RANK
36.9%
BACHELOR'S DEGREE
27.4/ 100
METRIC RATING
200th/ 347
METRIC RANK
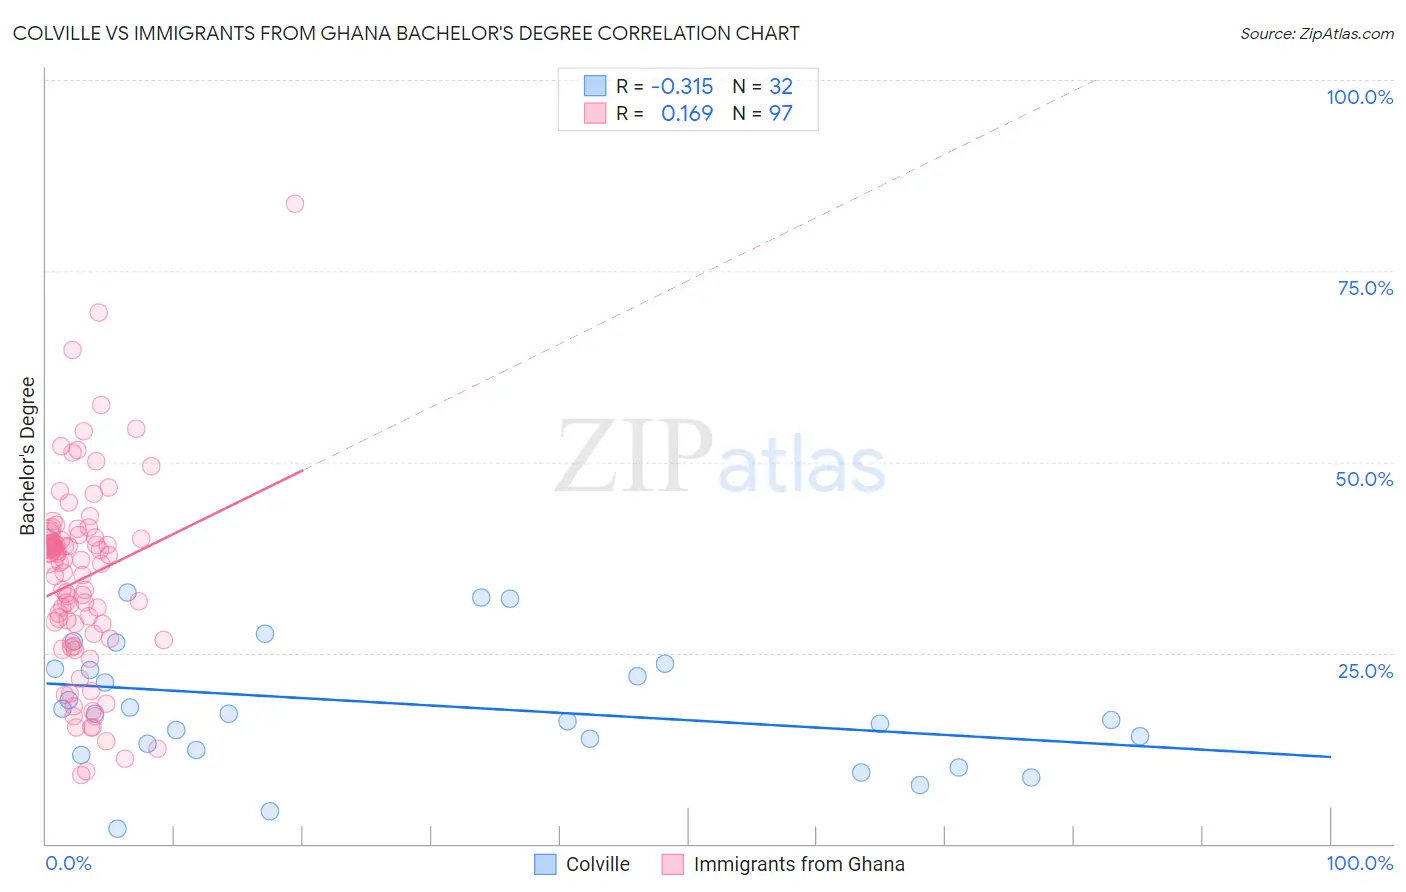
Colville vs Immigrants from Ghana Bachelor's Degree Correlation Chart
The statistical analysis conducted on geographies consisting of 34,683,925 people shows a mild negative correlation between the proportion of Colville and percentage of population with at least bachelor's degree education in the United States with a correlation coefficient (R) of -0.315 and weighted average of 29.0%. Similarly, the statistical analysis conducted on geographies consisting of 199,935,745 people shows a poor positive correlation between the proportion of Immigrants from Ghana and percentage of population with at least bachelor's degree education in the United States with a correlation coefficient (R) of 0.169 and weighted average of 36.9%, a difference of 27.3%.
Bachelor's Degree Correlation Summary
| Measurement | Colville | Immigrants from Ghana |
| Minimum | 1.9% | 9.1% |
| Maximum | 39.5% | 83.8% |
| Range | 37.5% | 74.7% |
| Mean | 18.3% | 34.7% |
| Median | 17.0% | 36.8% |
| Interquartile 25% (IQ1) | 12.7% | 26.7% |
| Interquartile 75% (IQ3) | 23.2% | 40.3% |
| Interquartile Range (IQR) | 10.6% | 13.5% |
| Standard Deviation (Sample) | 8.7% | 12.8% |
| Standard Deviation (Population) | 8.6% | 12.7% |
Similar Demographics by Bachelor's Degree
Demographics Similar to Colville by Bachelor's Degree
In terms of bachelor's degree, the demographic groups most similar to Colville are Yaqui (29.0%, a difference of 0.050%), Sioux (29.1%, a difference of 0.20%), Creek (28.9%, a difference of 0.50%), Kiowa (28.8%, a difference of 0.55%), and Alaskan Athabascan (28.8%, a difference of 0.63%).
| Demographics | Rating | Rank | Bachelor's Degree |
| Cheyenne | 0.0 /100 | #310 | Tragic 29.4% |
| Choctaw | 0.0 /100 | #311 | Tragic 29.4% |
| Seminole | 0.0 /100 | #312 | Tragic 29.4% |
| Alaska Natives | 0.0 /100 | #313 | Tragic 29.4% |
| Shoshone | 0.0 /100 | #314 | Tragic 29.3% |
| Immigrants | Cabo Verde | 0.0 /100 | #315 | Tragic 29.2% |
| Sioux | 0.0 /100 | #316 | Tragic 29.1% |
| Colville | 0.0 /100 | #317 | Tragic 29.0% |
| Yaqui | 0.0 /100 | #318 | Tragic 29.0% |
| Creek | 0.0 /100 | #319 | Tragic 28.9% |
| Kiowa | 0.0 /100 | #320 | Tragic 28.8% |
| Alaskan Athabascans | 0.0 /100 | #321 | Tragic 28.8% |
| Tsimshian | 0.0 /100 | #322 | Tragic 28.8% |
| Fijians | 0.0 /100 | #323 | Tragic 28.7% |
| Dutch West Indians | 0.0 /100 | #324 | Tragic 28.5% |
Demographics Similar to Immigrants from Ghana by Bachelor's Degree
In terms of bachelor's degree, the demographic groups most similar to Immigrants from Ghana are Immigrants from Costa Rica (36.9%, a difference of 0.0%), Welsh (37.0%, a difference of 0.21%), Czechoslovakian (37.0%, a difference of 0.22%), Immigrants from South Eastern Asia (36.8%, a difference of 0.26%), and Celtic (37.0%, a difference of 0.27%).
| Demographics | Rating | Rank | Bachelor's Degree |
| Yugoslavians | 31.5 /100 | #193 | Fair 37.1% |
| Belgians | 29.9 /100 | #194 | Fair 37.0% |
| Koreans | 29.8 /100 | #195 | Fair 37.0% |
| Celtics | 29.5 /100 | #196 | Fair 37.0% |
| Czechoslovakians | 29.2 /100 | #197 | Fair 37.0% |
| Welsh | 29.1 /100 | #198 | Fair 37.0% |
| Immigrants | Costa Rica | 27.4 /100 | #199 | Fair 36.9% |
| Immigrants | Ghana | 27.4 /100 | #200 | Fair 36.9% |
| Immigrants | South Eastern Asia | 25.4 /100 | #201 | Fair 36.8% |
| Immigrants | Zaire | 25.3 /100 | #202 | Fair 36.8% |
| Immigrants | Nigeria | 23.1 /100 | #203 | Fair 36.7% |
| Immigrants | Immigrants | 22.8 /100 | #204 | Fair 36.7% |
| Finns | 22.2 /100 | #205 | Fair 36.7% |
| Spaniards | 21.2 /100 | #206 | Fair 36.6% |
| Immigrants | Middle Africa | 20.6 /100 | #207 | Fair 36.6% |