Immigrants from Bosnia and Herzegovina vs Immigrants from Cuba 11th Grade
COMPARE
Immigrants from Bosnia and Herzegovina
Immigrants from Cuba
11th Grade
11th Grade Comparison
Immigrants from Bosnia and Herzegovina
Immigrants from Cuba
93.0%
11TH GRADE
89.0/ 100
METRIC RATING
132nd/ 347
METRIC RANK
88.9%
11TH GRADE
0.0/ 100
METRIC RATING
316th/ 347
METRIC RANK
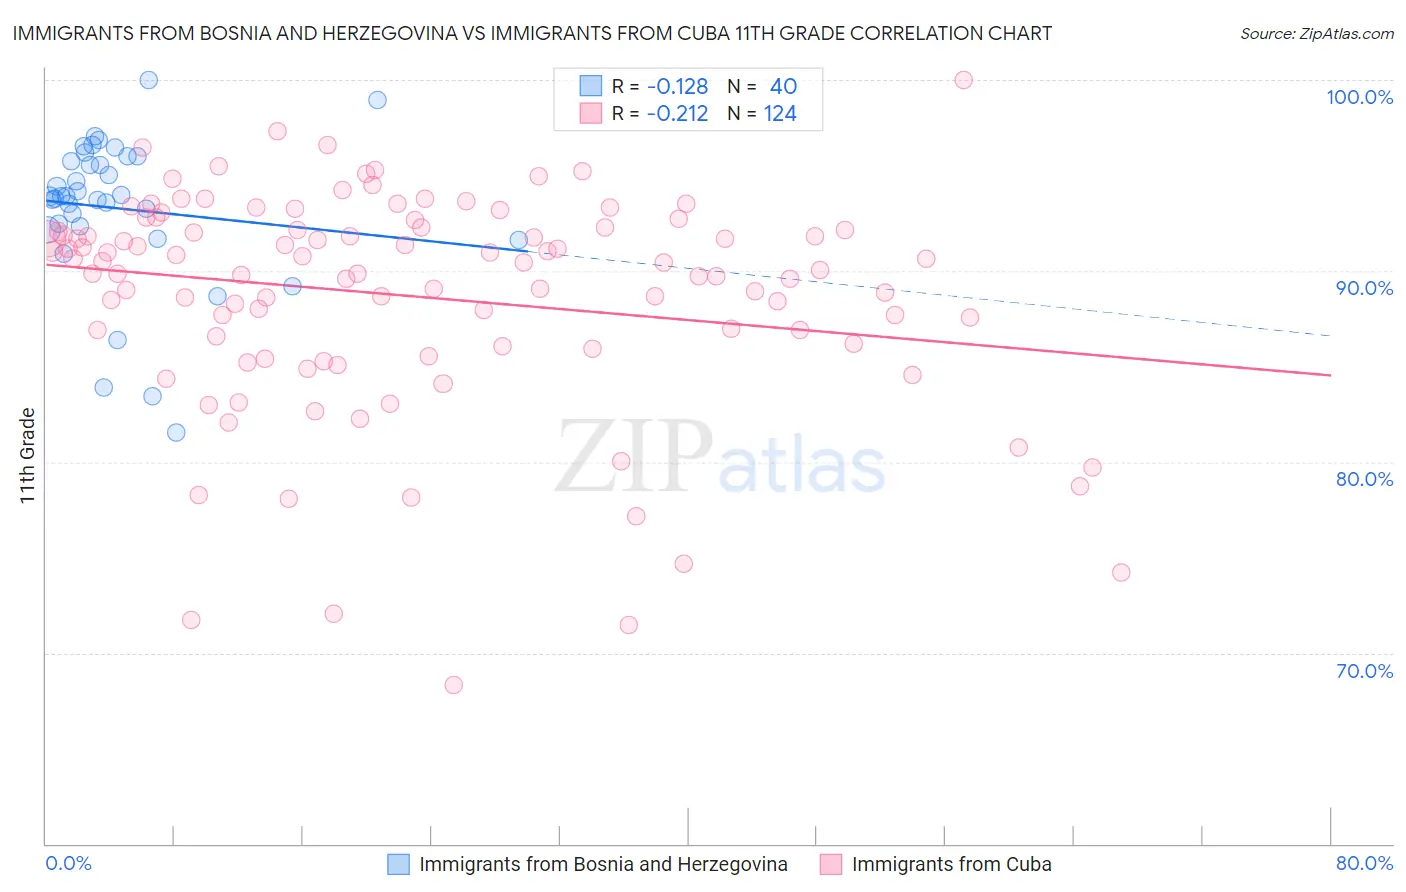
Immigrants from Bosnia and Herzegovina vs Immigrants from Cuba 11th Grade Correlation Chart
The statistical analysis conducted on geographies consisting of 156,819,615 people shows a poor negative correlation between the proportion of Immigrants from Bosnia and Herzegovina and percentage of population with at least 11th grade education in the United States with a correlation coefficient (R) of -0.128 and weighted average of 93.0%. Similarly, the statistical analysis conducted on geographies consisting of 326,028,015 people shows a weak negative correlation between the proportion of Immigrants from Cuba and percentage of population with at least 11th grade education in the United States with a correlation coefficient (R) of -0.212 and weighted average of 88.9%, a difference of 4.6%.
11th Grade Correlation Summary
| Measurement | Immigrants from Bosnia and Herzegovina | Immigrants from Cuba |
| Minimum | 81.5% | 68.3% |
| Maximum | 100.0% | 100.0% |
| Range | 18.5% | 31.7% |
| Mean | 93.3% | 88.7% |
| Median | 93.9% | 90.2% |
| Interquartile 25% (IQ1) | 92.3% | 86.1% |
| Interquartile 75% (IQ3) | 95.9% | 92.2% |
| Interquartile Range (IQR) | 3.6% | 6.1% |
| Standard Deviation (Sample) | 3.9% | 5.8% |
| Standard Deviation (Population) | 3.9% | 5.8% |
Similar Demographics by 11th Grade
Demographics Similar to Immigrants from Bosnia and Herzegovina by 11th Grade
In terms of 11th grade, the demographic groups most similar to Immigrants from Bosnia and Herzegovina are Albanian (93.0%, a difference of 0.010%), Egyptian (93.0%, a difference of 0.010%), Immigrants from Ukraine (93.0%, a difference of 0.020%), Mongolian (93.0%, a difference of 0.030%), and Delaware (93.0%, a difference of 0.040%).
| Demographics | Rating | Rank | 11th Grade |
| Immigrants | Sri Lanka | 95.6 /100 | #125 | Exceptional 93.2% |
| Basques | 95.2 /100 | #126 | Exceptional 93.2% |
| Immigrants | Kazakhstan | 92.4 /100 | #127 | Exceptional 93.1% |
| Immigrants | Jordan | 92.4 /100 | #128 | Exceptional 93.1% |
| Immigrants | Ukraine | 89.8 /100 | #129 | Excellent 93.0% |
| Albanians | 89.5 /100 | #130 | Excellent 93.0% |
| Egyptians | 89.5 /100 | #131 | Excellent 93.0% |
| Immigrants | Bosnia and Herzegovina | 89.0 /100 | #132 | Excellent 93.0% |
| Mongolians | 87.6 /100 | #133 | Excellent 93.0% |
| Delaware | 87.3 /100 | #134 | Excellent 93.0% |
| Immigrants | Italy | 86.6 /100 | #135 | Excellent 92.9% |
| Cree | 85.9 /100 | #136 | Excellent 92.9% |
| Arabs | 85.4 /100 | #137 | Excellent 92.9% |
| Immigrants | Brazil | 85.1 /100 | #138 | Excellent 92.9% |
| Crow | 84.1 /100 | #139 | Excellent 92.9% |
Demographics Similar to Immigrants from Cuba by 11th Grade
In terms of 11th grade, the demographic groups most similar to Immigrants from Cuba are Lumbee (88.9%, a difference of 0.010%), Nicaraguan (88.9%, a difference of 0.070%), Immigrants from Ecuador (89.1%, a difference of 0.15%), Cape Verdean (89.1%, a difference of 0.16%), and Belizean (88.8%, a difference of 0.16%).
| Demographics | Rating | Rank | 11th Grade |
| Immigrants | Bangladesh | 0.0 /100 | #309 | Tragic 89.5% |
| Yaqui | 0.0 /100 | #310 | Tragic 89.5% |
| Vietnamese | 0.0 /100 | #311 | Tragic 89.4% |
| Immigrants | Portugal | 0.0 /100 | #312 | Tragic 89.3% |
| Immigrants | Caribbean | 0.0 /100 | #313 | Tragic 89.1% |
| Cape Verdeans | 0.0 /100 | #314 | Tragic 89.1% |
| Immigrants | Ecuador | 0.0 /100 | #315 | Tragic 89.1% |
| Immigrants | Cuba | 0.0 /100 | #316 | Tragic 88.9% |
| Lumbee | 0.0 /100 | #317 | Tragic 88.9% |
| Nicaraguans | 0.0 /100 | #318 | Tragic 88.9% |
| Belizeans | 0.0 /100 | #319 | Tragic 88.8% |
| Immigrants | Armenia | 0.0 /100 | #320 | Tragic 88.8% |
| Immigrants | Belize | 0.0 /100 | #321 | Tragic 88.7% |
| Puerto Ricans | 0.0 /100 | #322 | Tragic 88.4% |
| Pima | 0.0 /100 | #323 | Tragic 88.3% |