South African vs Immigrants from Cuba 11th Grade
COMPARE
South African
Immigrants from Cuba
11th Grade
11th Grade Comparison
South Africans
Immigrants from Cuba
93.6%
11TH GRADE
99.2/ 100
METRIC RATING
91st/ 347
METRIC RANK
88.9%
11TH GRADE
0.0/ 100
METRIC RATING
316th/ 347
METRIC RANK
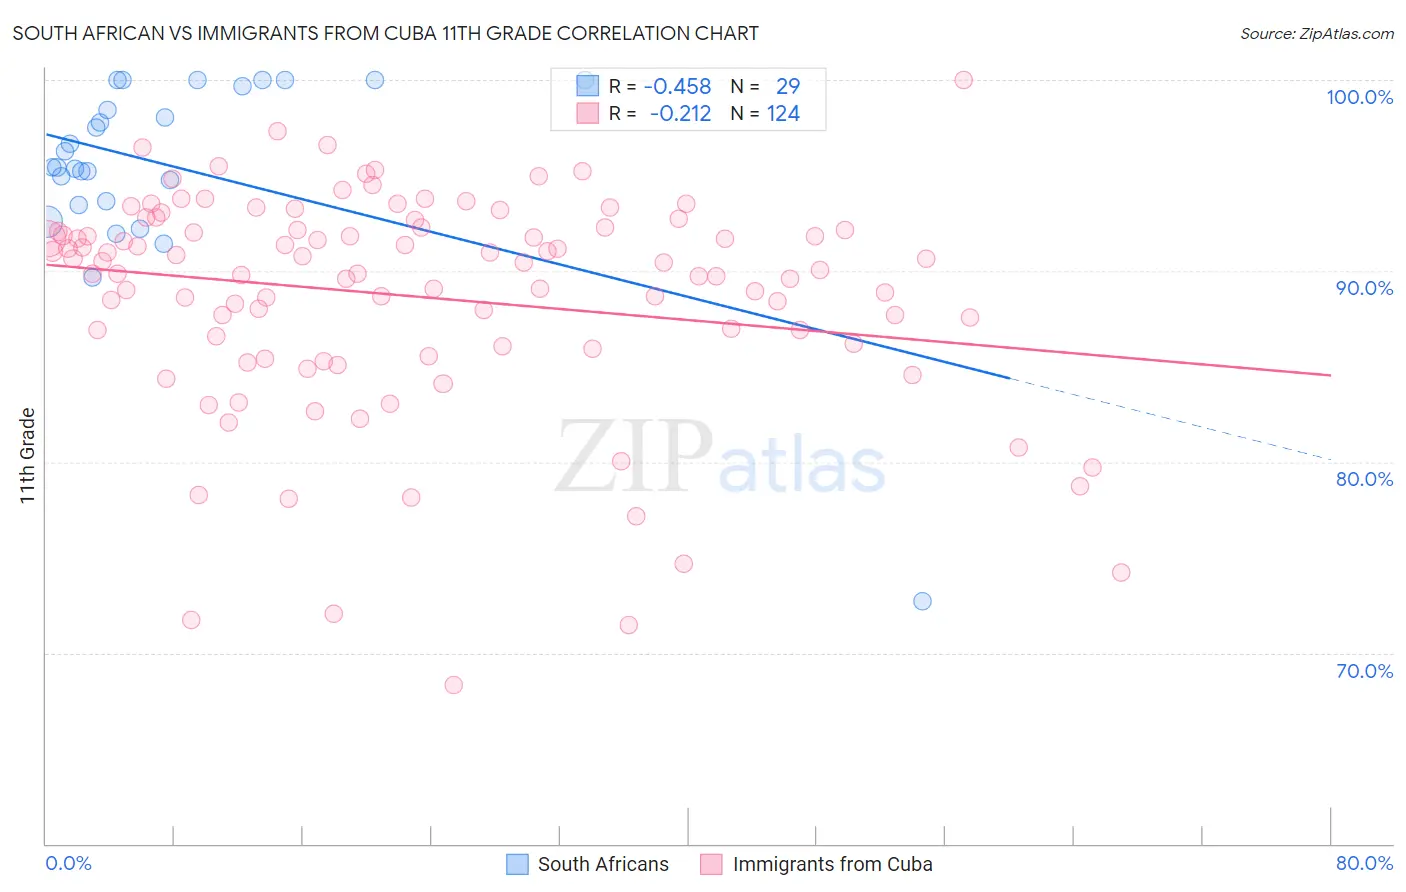
South African vs Immigrants from Cuba 11th Grade Correlation Chart
The statistical analysis conducted on geographies consisting of 182,604,532 people shows a moderate negative correlation between the proportion of South Africans and percentage of population with at least 11th grade education in the United States with a correlation coefficient (R) of -0.458 and weighted average of 93.6%. Similarly, the statistical analysis conducted on geographies consisting of 326,028,015 people shows a weak negative correlation between the proportion of Immigrants from Cuba and percentage of population with at least 11th grade education in the United States with a correlation coefficient (R) of -0.212 and weighted average of 88.9%, a difference of 5.2%.
11th Grade Correlation Summary
| Measurement | South African | Immigrants from Cuba |
| Minimum | 72.7% | 68.3% |
| Maximum | 100.0% | 100.0% |
| Range | 27.3% | 31.7% |
| Mean | 95.5% | 88.7% |
| Median | 95.4% | 90.2% |
| Interquartile 25% (IQ1) | 93.6% | 86.1% |
| Interquartile 75% (IQ3) | 99.8% | 92.2% |
| Interquartile Range (IQR) | 6.3% | 6.1% |
| Standard Deviation (Sample) | 5.3% | 5.8% |
| Standard Deviation (Population) | 5.2% | 5.8% |
Similar Demographics by 11th Grade
Demographics Similar to South Africans by 11th Grade
In terms of 11th grade, the demographic groups most similar to South Africans are Ottawa (93.6%, a difference of 0.010%), Immigrants from Bulgaria (93.6%, a difference of 0.010%), Immigrants from South Central Asia (93.6%, a difference of 0.020%), Immigrants from Western Europe (93.6%, a difference of 0.020%), and Cambodian (93.6%, a difference of 0.020%).
| Demographics | Rating | Rank | 11th Grade |
| Immigrants | Taiwan | 99.3 /100 | #84 | Exceptional 93.6% |
| Immigrants | Switzerland | 99.3 /100 | #85 | Exceptional 93.6% |
| Immigrants | South Central Asia | 99.2 /100 | #86 | Exceptional 93.6% |
| Immigrants | Western Europe | 99.2 /100 | #87 | Exceptional 93.6% |
| Cambodians | 99.2 /100 | #88 | Exceptional 93.6% |
| Burmese | 99.2 /100 | #89 | Exceptional 93.6% |
| Ottawa | 99.2 /100 | #90 | Exceptional 93.6% |
| South Africans | 99.2 /100 | #91 | Exceptional 93.6% |
| Immigrants | Bulgaria | 99.1 /100 | #92 | Exceptional 93.6% |
| Puget Sound Salish | 99.1 /100 | #93 | Exceptional 93.6% |
| Swiss | 99.0 /100 | #94 | Exceptional 93.6% |
| Immigrants | France | 99.0 /100 | #95 | Exceptional 93.6% |
| Immigrants | Turkey | 98.9 /100 | #96 | Exceptional 93.5% |
| Immigrants | Iran | 98.9 /100 | #97 | Exceptional 93.5% |
| Immigrants | Israel | 98.8 /100 | #98 | Exceptional 93.5% |
Demographics Similar to Immigrants from Cuba by 11th Grade
In terms of 11th grade, the demographic groups most similar to Immigrants from Cuba are Lumbee (88.9%, a difference of 0.010%), Nicaraguan (88.9%, a difference of 0.070%), Immigrants from Ecuador (89.1%, a difference of 0.15%), Cape Verdean (89.1%, a difference of 0.16%), and Belizean (88.8%, a difference of 0.16%).
| Demographics | Rating | Rank | 11th Grade |
| Immigrants | Bangladesh | 0.0 /100 | #309 | Tragic 89.5% |
| Yaqui | 0.0 /100 | #310 | Tragic 89.5% |
| Vietnamese | 0.0 /100 | #311 | Tragic 89.4% |
| Immigrants | Portugal | 0.0 /100 | #312 | Tragic 89.3% |
| Immigrants | Caribbean | 0.0 /100 | #313 | Tragic 89.1% |
| Cape Verdeans | 0.0 /100 | #314 | Tragic 89.1% |
| Immigrants | Ecuador | 0.0 /100 | #315 | Tragic 89.1% |
| Immigrants | Cuba | 0.0 /100 | #316 | Tragic 88.9% |
| Lumbee | 0.0 /100 | #317 | Tragic 88.9% |
| Nicaraguans | 0.0 /100 | #318 | Tragic 88.9% |
| Belizeans | 0.0 /100 | #319 | Tragic 88.8% |
| Immigrants | Armenia | 0.0 /100 | #320 | Tragic 88.8% |
| Immigrants | Belize | 0.0 /100 | #321 | Tragic 88.7% |
| Puerto Ricans | 0.0 /100 | #322 | Tragic 88.4% |
| Pima | 0.0 /100 | #323 | Tragic 88.3% |