Immigrants from Burma/Myanmar vs German Russian Seniors Poverty Over the Age of 75
COMPARE
Immigrants from Burma/Myanmar
German Russian
Seniors Poverty Over the Age of 75
Seniors Poverty Over the Age of 75 Comparison
Immigrants from Burma/Myanmar
German Russians
12.1%
SENIORS POVERTY OVER THE AGE OF 75
62.3/ 100
METRIC RATING
156th/ 347
METRIC RANK
12.3%
SENIORS POVERTY OVER THE AGE OF 75
41.4/ 100
METRIC RATING
182nd/ 347
METRIC RANK
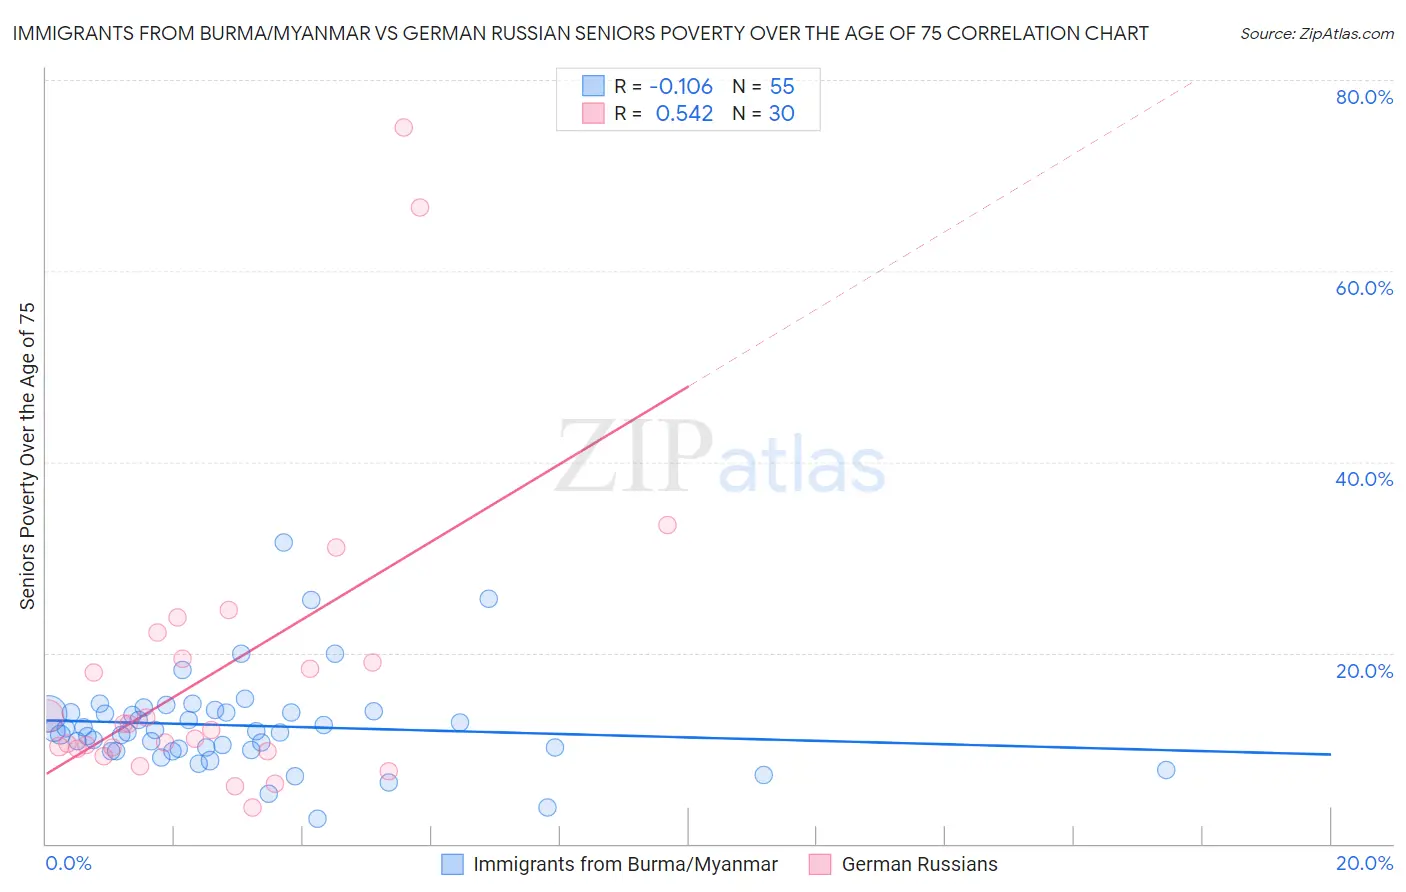
Immigrants from Burma/Myanmar vs German Russian Seniors Poverty Over the Age of 75 Correlation Chart
The statistical analysis conducted on geographies consisting of 171,617,389 people shows a poor negative correlation between the proportion of Immigrants from Burma/Myanmar and poverty level among seniors over the age of 75 in the United States with a correlation coefficient (R) of -0.106 and weighted average of 12.1%. Similarly, the statistical analysis conducted on geographies consisting of 96,005,724 people shows a substantial positive correlation between the proportion of German Russians and poverty level among seniors over the age of 75 in the United States with a correlation coefficient (R) of 0.542 and weighted average of 12.3%, a difference of 1.8%.
Seniors Poverty Over the Age of 75 Correlation Summary
| Measurement | Immigrants from Burma/Myanmar | German Russian |
| Minimum | 2.6% | 3.8% |
| Maximum | 31.5% | 75.0% |
| Range | 28.9% | 71.2% |
| Mean | 12.4% | 17.9% |
| Median | 11.8% | 12.2% |
| Interquartile 25% (IQ1) | 9.8% | 9.9% |
| Interquartile 75% (IQ3) | 13.8% | 19.4% |
| Interquartile Range (IQR) | 4.0% | 9.5% |
| Standard Deviation (Sample) | 5.0% | 16.1% |
| Standard Deviation (Population) | 4.9% | 15.8% |
Similar Demographics by Seniors Poverty Over the Age of 75
Demographics Similar to Immigrants from Burma/Myanmar by Seniors Poverty Over the Age of 75
In terms of seniors poverty over the age of 75, the demographic groups most similar to Immigrants from Burma/Myanmar are Indonesian (12.1%, a difference of 0.020%), Immigrants from Sudan (12.1%, a difference of 0.060%), Portuguese (12.1%, a difference of 0.090%), Immigrants from Middle Africa (12.1%, a difference of 0.10%), and Immigrants from Eastern Africa (12.1%, a difference of 0.13%).
| Demographics | Rating | Rank | Seniors Poverty Over the Age of 75 |
| Asians | 67.4 /100 | #149 | Good 12.0% |
| Cypriots | 67.3 /100 | #150 | Good 12.0% |
| Cherokee | 65.8 /100 | #151 | Good 12.0% |
| Immigrants | Korea | 65.5 /100 | #152 | Good 12.0% |
| Immigrants | Turkey | 64.7 /100 | #153 | Good 12.0% |
| Cambodians | 64.0 /100 | #154 | Good 12.0% |
| Indonesians | 62.6 /100 | #155 | Good 12.1% |
| Immigrants | Burma/Myanmar | 62.3 /100 | #156 | Good 12.1% |
| Immigrants | Sudan | 61.7 /100 | #157 | Good 12.1% |
| Portuguese | 61.3 /100 | #158 | Good 12.1% |
| Immigrants | Middle Africa | 61.2 /100 | #159 | Good 12.1% |
| Immigrants | Eastern Africa | 60.9 /100 | #160 | Good 12.1% |
| Immigrants | Norway | 60.6 /100 | #161 | Good 12.1% |
| Immigrants | Serbia | 60.2 /100 | #162 | Good 12.1% |
| Immigrants | Greece | 58.2 /100 | #163 | Average 12.1% |
Demographics Similar to German Russians by Seniors Poverty Over the Age of 75
In terms of seniors poverty over the age of 75, the demographic groups most similar to German Russians are Immigrants from Australia (12.2%, a difference of 0.23%), Immigrants from South Eastern Asia (12.2%, a difference of 0.24%), Laotian (12.3%, a difference of 0.27%), Mongolian (12.2%, a difference of 0.34%), and Nonimmigrants (12.2%, a difference of 0.45%).
| Demographics | Rating | Rank | Seniors Poverty Over the Age of 75 |
| Immigrants | Saudi Arabia | 49.5 /100 | #175 | Average 12.2% |
| Immigrants | Iran | 48.1 /100 | #176 | Average 12.2% |
| Immigrants | Asia | 47.8 /100 | #177 | Average 12.2% |
| Immigrants | Nonimmigrants | 46.8 /100 | #178 | Average 12.2% |
| Mongolians | 45.5 /100 | #179 | Average 12.2% |
| Immigrants | South Eastern Asia | 44.3 /100 | #180 | Average 12.2% |
| Immigrants | Australia | 44.2 /100 | #181 | Average 12.2% |
| German Russians | 41.4 /100 | #182 | Average 12.3% |
| Laotians | 38.2 /100 | #183 | Fair 12.3% |
| Kiowa | 36.0 /100 | #184 | Fair 12.3% |
| Immigrants | Malaysia | 35.8 /100 | #185 | Fair 12.3% |
| Sri Lankans | 32.3 /100 | #186 | Fair 12.4% |
| Yaqui | 25.9 /100 | #187 | Fair 12.5% |
| Immigrants | Northern Africa | 25.2 /100 | #188 | Fair 12.5% |
| Immigrants | Indonesia | 24.4 /100 | #189 | Fair 12.5% |