Immigrants from Bahamas vs German Russian No Schooling Completed
COMPARE
Immigrants from Bahamas
German Russian
No Schooling Completed
No Schooling Completed Comparison
Immigrants from Bahamas
German Russians
2.2%
NO SCHOOLING COMPLETED
11.6/ 100
METRIC RATING
205th/ 347
METRIC RANK
1.8%
NO SCHOOLING COMPLETED
97.5/ 100
METRIC RATING
105th/ 347
METRIC RANK
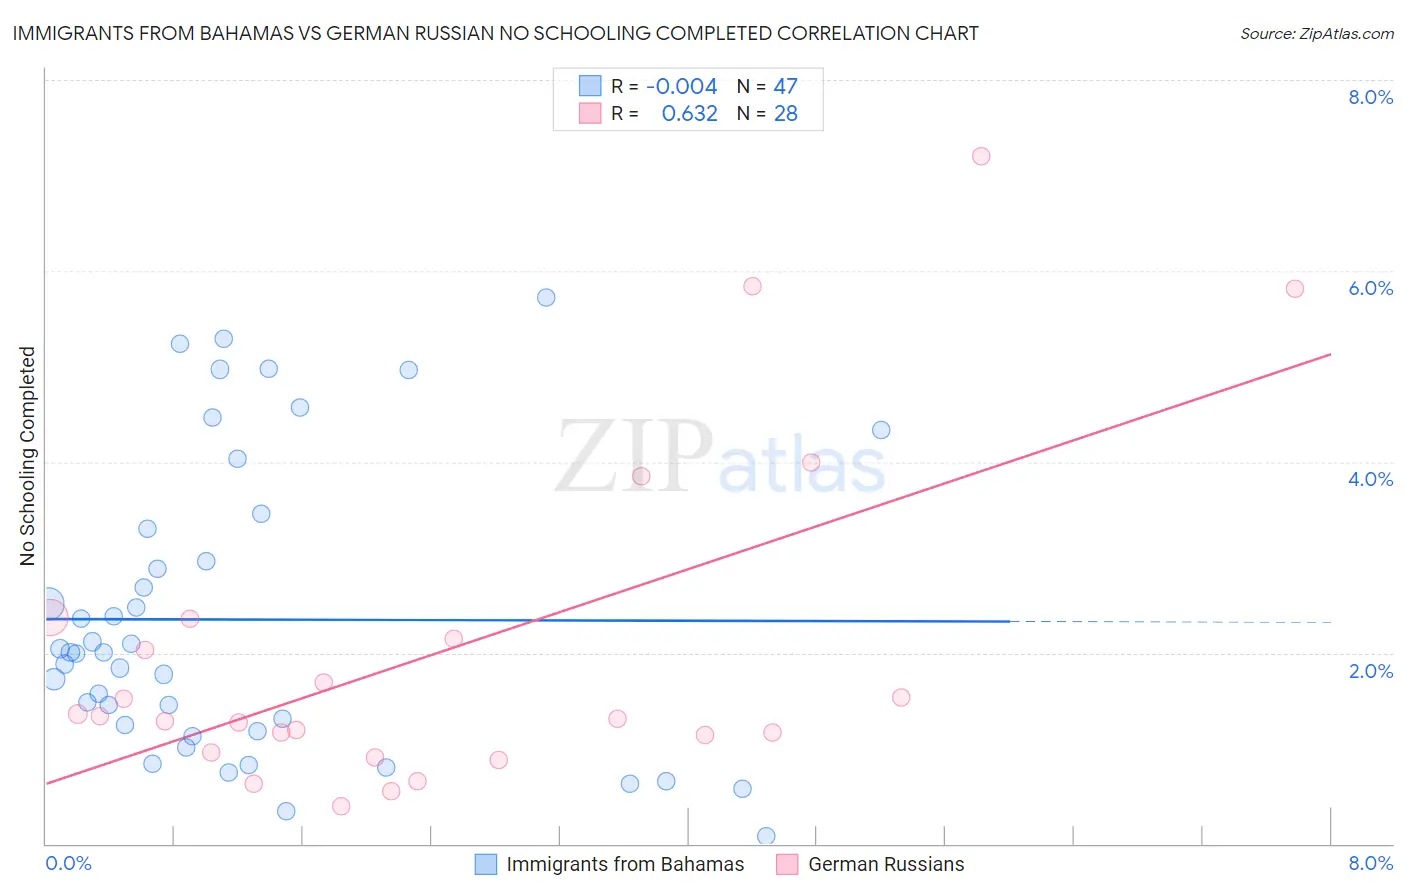
Immigrants from Bahamas vs German Russian No Schooling Completed Correlation Chart
The statistical analysis conducted on geographies consisting of 104,436,270 people shows no correlation between the proportion of Immigrants from Bahamas and percentage of population with no schooling in the United States with a correlation coefficient (R) of -0.004 and weighted average of 2.2%. Similarly, the statistical analysis conducted on geographies consisting of 96,119,740 people shows a significant positive correlation between the proportion of German Russians and percentage of population with no schooling in the United States with a correlation coefficient (R) of 0.632 and weighted average of 1.8%, a difference of 21.8%.
No Schooling Completed Correlation Summary
| Measurement | Immigrants from Bahamas | German Russian |
| Minimum | 0.079% | 0.39% |
| Maximum | 5.7% | 7.2% |
| Range | 5.6% | 6.8% |
| Mean | 2.3% | 2.0% |
| Median | 2.0% | 1.3% |
| Interquartile 25% (IQ1) | 1.2% | 1.0% |
| Interquartile 75% (IQ3) | 3.3% | 2.3% |
| Interquartile Range (IQR) | 2.1% | 1.2% |
| Standard Deviation (Sample) | 1.5% | 1.7% |
| Standard Deviation (Population) | 1.5% | 1.7% |
Similar Demographics by No Schooling Completed
Demographics Similar to Immigrants from Bahamas by No Schooling Completed
In terms of no schooling completed, the demographic groups most similar to Immigrants from Bahamas are Bahamian (2.2%, a difference of 0.010%), South American Indian (2.2%, a difference of 0.19%), Uruguayan (2.2%, a difference of 0.19%), Hopi (2.2%, a difference of 0.40%), and Immigrants from Oceania (2.2%, a difference of 0.45%).
| Demographics | Rating | Rank | No Schooling Completed |
| Immigrants | Chile | 22.7 /100 | #198 | Fair 2.2% |
| Africans | 21.8 /100 | #199 | Fair 2.2% |
| Immigrants | Northern Africa | 19.5 /100 | #200 | Poor 2.2% |
| Costa Ricans | 17.1 /100 | #201 | Poor 2.2% |
| Moroccans | 13.7 /100 | #202 | Poor 2.2% |
| Laotians | 13.3 /100 | #203 | Poor 2.2% |
| Hopi | 12.9 /100 | #204 | Poor 2.2% |
| Immigrants | Bahamas | 11.6 /100 | #205 | Poor 2.2% |
| Bahamians | 11.6 /100 | #206 | Poor 2.2% |
| South American Indians | 11.0 /100 | #207 | Poor 2.2% |
| Uruguayans | 11.0 /100 | #208 | Poor 2.2% |
| Immigrants | Oceania | 10.2 /100 | #209 | Poor 2.2% |
| Natives/Alaskans | 10.0 /100 | #210 | Tragic 2.2% |
| Immigrants | Panama | 8.8 /100 | #211 | Tragic 2.3% |
| Immigrants | Morocco | 8.7 /100 | #212 | Tragic 2.3% |
Demographics Similar to German Russians by No Schooling Completed
In terms of no schooling completed, the demographic groups most similar to German Russians are Thai (1.8%, a difference of 0.020%), Immigrants from France (1.8%, a difference of 0.40%), Yugoslavian (1.8%, a difference of 0.44%), Basque (1.8%, a difference of 0.60%), and Immigrants from Switzerland (1.8%, a difference of 0.65%).
| Demographics | Rating | Rank | No Schooling Completed |
| Iranians | 98.2 /100 | #98 | Exceptional 1.8% |
| Choctaw | 98.1 /100 | #99 | Exceptional 1.8% |
| Immigrants | Singapore | 98.0 /100 | #100 | Exceptional 1.8% |
| Immigrants | Czechoslovakia | 97.9 /100 | #101 | Exceptional 1.8% |
| Immigrants | Switzerland | 97.9 /100 | #102 | Exceptional 1.8% |
| Basques | 97.9 /100 | #103 | Exceptional 1.8% |
| Thais | 97.5 /100 | #104 | Exceptional 1.8% |
| German Russians | 97.5 /100 | #105 | Exceptional 1.8% |
| Immigrants | France | 97.3 /100 | #106 | Exceptional 1.8% |
| Yugoslavians | 97.2 /100 | #107 | Exceptional 1.8% |
| Okinawans | 97.1 /100 | #108 | Exceptional 1.8% |
| Immigrants | Saudi Arabia | 96.8 /100 | #109 | Exceptional 1.9% |
| Immigrants | Latvia | 96.7 /100 | #110 | Exceptional 1.9% |
| Immigrants | Japan | 96.6 /100 | #111 | Exceptional 1.9% |
| Pueblo | 96.4 /100 | #112 | Exceptional 1.9% |