Immigrants from Micronesia vs British Bachelor's Degree
COMPARE
Immigrants from Micronesia
British
Bachelor's Degree
Bachelor's Degree Comparison
Immigrants from Micronesia
British
30.4%
BACHELOR'S DEGREE
0.0/ 100
METRIC RATING
300th/ 347
METRIC RANK
40.4%
BACHELOR'S DEGREE
94.2/ 100
METRIC RATING
125th/ 347
METRIC RANK
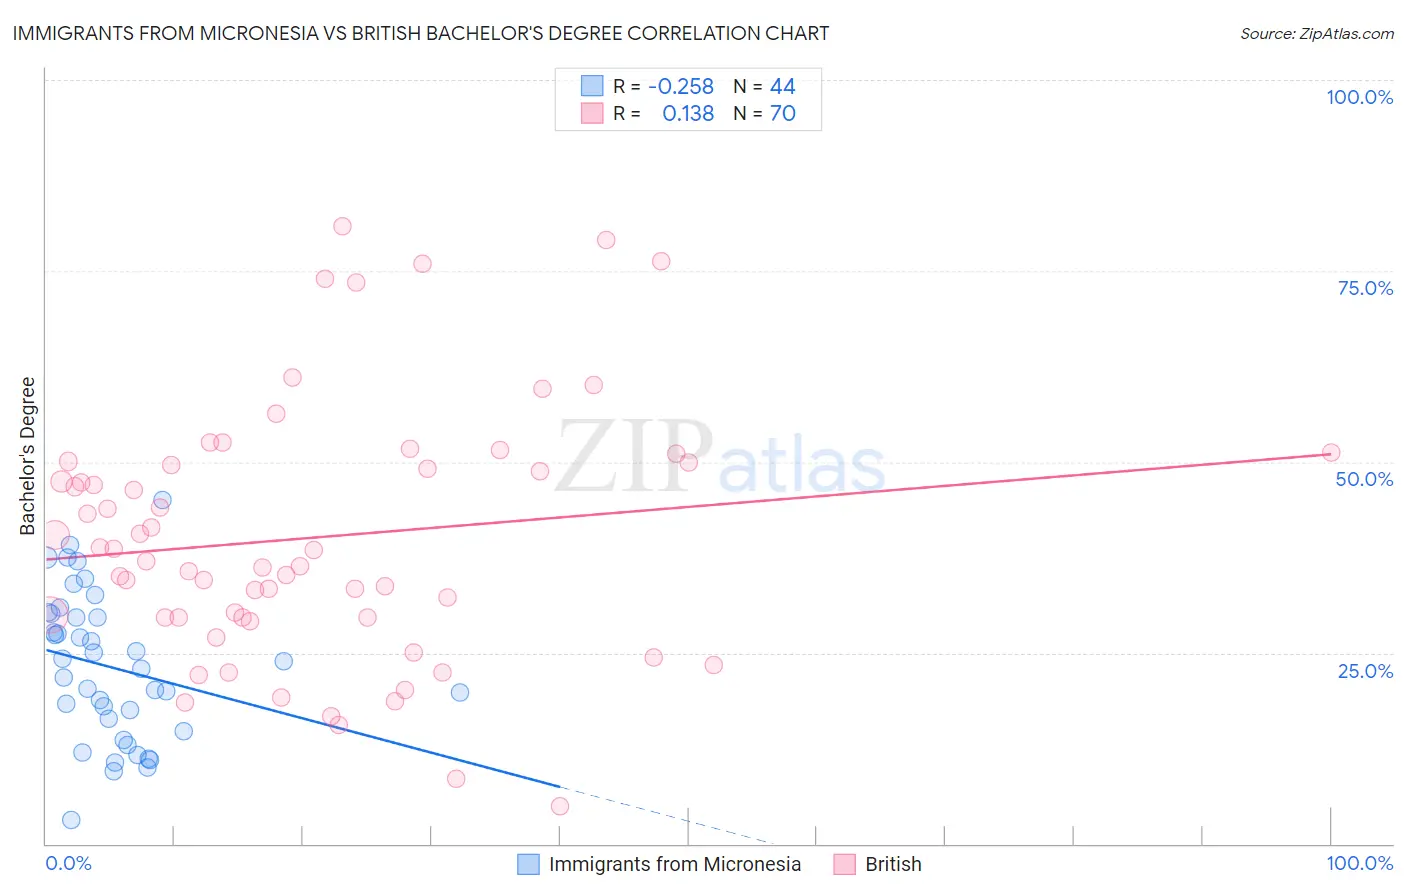
Immigrants from Micronesia vs British Bachelor's Degree Correlation Chart
The statistical analysis conducted on geographies consisting of 61,608,325 people shows a weak negative correlation between the proportion of Immigrants from Micronesia and percentage of population with at least bachelor's degree education in the United States with a correlation coefficient (R) of -0.258 and weighted average of 30.4%. Similarly, the statistical analysis conducted on geographies consisting of 531,374,091 people shows a poor positive correlation between the proportion of British and percentage of population with at least bachelor's degree education in the United States with a correlation coefficient (R) of 0.138 and weighted average of 40.4%, a difference of 32.9%.
Bachelor's Degree Correlation Summary
| Measurement | Immigrants from Micronesia | British |
| Minimum | 3.0% | 5.0% |
| Maximum | 45.0% | 80.9% |
| Range | 42.0% | 76.0% |
| Mean | 23.1% | 40.1% |
| Median | 23.5% | 37.7% |
| Interquartile 25% (IQ1) | 15.6% | 29.6% |
| Interquartile 75% (IQ3) | 29.9% | 50.0% |
| Interquartile Range (IQR) | 14.4% | 20.4% |
| Standard Deviation (Sample) | 9.6% | 16.7% |
| Standard Deviation (Population) | 9.5% | 16.6% |
Similar Demographics by Bachelor's Degree
Demographics Similar to Immigrants from Micronesia by Bachelor's Degree
In terms of bachelor's degree, the demographic groups most similar to Immigrants from Micronesia are Chickasaw (30.4%, a difference of 0.020%), Immigrants from Cuba (30.3%, a difference of 0.22%), Mexican American Indian (30.2%, a difference of 0.49%), Chippewa (30.6%, a difference of 0.54%), and Bangladeshi (30.2%, a difference of 0.66%).
| Demographics | Rating | Rank | Bachelor's Degree |
| Cape Verdeans | 0.1 /100 | #293 | Tragic 30.9% |
| Immigrants | Guatemala | 0.0 /100 | #294 | Tragic 30.8% |
| Immigrants | Dominican Republic | 0.0 /100 | #295 | Tragic 30.7% |
| Puget Sound Salish | 0.0 /100 | #296 | Tragic 30.7% |
| Immigrants | Haiti | 0.0 /100 | #297 | Tragic 30.6% |
| Chippewa | 0.0 /100 | #298 | Tragic 30.6% |
| Chickasaw | 0.0 /100 | #299 | Tragic 30.4% |
| Immigrants | Micronesia | 0.0 /100 | #300 | Tragic 30.4% |
| Immigrants | Cuba | 0.0 /100 | #301 | Tragic 30.3% |
| Mexican American Indians | 0.0 /100 | #302 | Tragic 30.2% |
| Bangladeshis | 0.0 /100 | #303 | Tragic 30.2% |
| Cherokee | 0.0 /100 | #304 | Tragic 30.2% |
| Immigrants | Latin America | 0.0 /100 | #305 | Tragic 30.1% |
| Immigrants | Yemen | 0.0 /100 | #306 | Tragic 29.9% |
| Nepalese | 0.0 /100 | #307 | Tragic 29.9% |
Demographics Similar to British by Bachelor's Degree
In terms of bachelor's degree, the demographic groups most similar to British are Immigrants from Eritrea (40.4%, a difference of 0.030%), Lebanese (40.4%, a difference of 0.040%), Immigrants from Eastern Africa (40.4%, a difference of 0.050%), Immigrants from Albania (40.4%, a difference of 0.060%), and Moroccan (40.5%, a difference of 0.16%).
| Demographics | Rating | Rank | Bachelor's Degree |
| Croatians | 95.5 /100 | #118 | Exceptional 40.6% |
| Immigrants | Syria | 94.9 /100 | #119 | Exceptional 40.5% |
| Venezuelans | 94.7 /100 | #120 | Exceptional 40.5% |
| Moroccans | 94.6 /100 | #121 | Exceptional 40.5% |
| Immigrants | Albania | 94.4 /100 | #122 | Exceptional 40.4% |
| Lebanese | 94.3 /100 | #123 | Exceptional 40.4% |
| Immigrants | Eritrea | 94.3 /100 | #124 | Exceptional 40.4% |
| British | 94.2 /100 | #125 | Exceptional 40.4% |
| Immigrants | Eastern Africa | 94.1 /100 | #126 | Exceptional 40.4% |
| Immigrants | Jordan | 93.4 /100 | #127 | Exceptional 40.3% |
| Immigrants | Venezuela | 92.9 /100 | #128 | Exceptional 40.2% |
| Serbians | 92.4 /100 | #129 | Exceptional 40.1% |
| Sierra Leoneans | 92.2 /100 | #130 | Exceptional 40.1% |
| Italians | 91.9 /100 | #131 | Exceptional 40.1% |
| Taiwanese | 91.1 /100 | #132 | Exceptional 40.0% |