Immigrants from Burma/Myanmar vs British Unemployment Among Ages 60 to 64 years
COMPARE
Immigrants from Burma/Myanmar
British
Unemployment Among Ages 60 to 64 years
Unemployment Among Ages 60 to 64 years Comparison
Immigrants from Burma/Myanmar
British
4.4%
UNEMPLOYMENT AMONG AGES 60 TO 64 YEARS
100.0/ 100
METRIC RATING
24th/ 347
METRIC RANK
4.6%
UNEMPLOYMENT AMONG AGES 60 TO 64 YEARS
99.9/ 100
METRIC RATING
57th/ 347
METRIC RANK
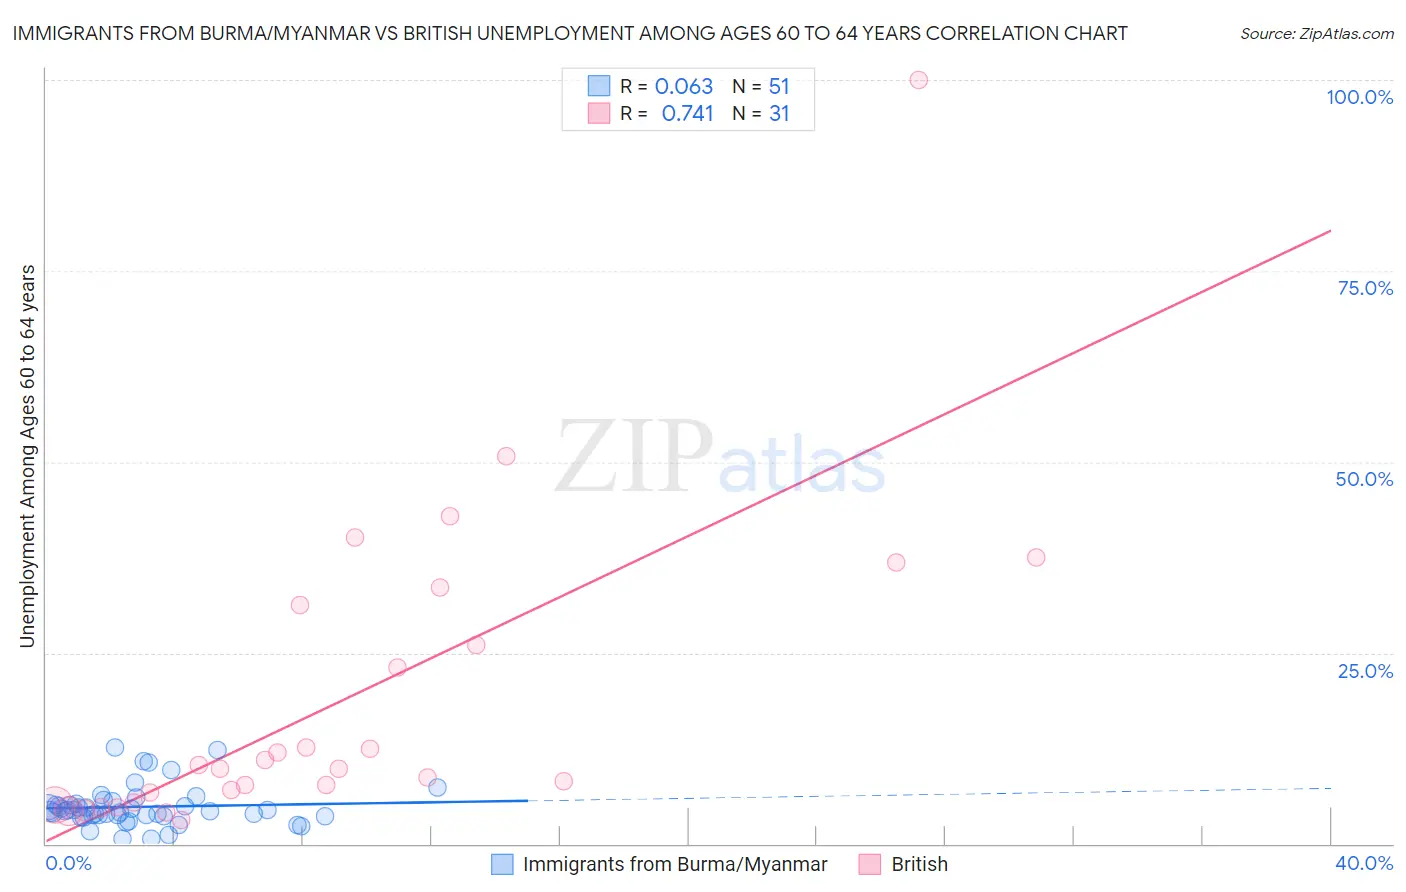
Immigrants from Burma/Myanmar vs British Unemployment Among Ages 60 to 64 years Correlation Chart
The statistical analysis conducted on geographies consisting of 165,064,004 people shows a slight positive correlation between the proportion of Immigrants from Burma/Myanmar and unemployment rate among population between the ages 60 and 64 in the United States with a correlation coefficient (R) of 0.063 and weighted average of 4.4%. Similarly, the statistical analysis conducted on geographies consisting of 446,607,346 people shows a strong positive correlation between the proportion of British and unemployment rate among population between the ages 60 and 64 in the United States with a correlation coefficient (R) of 0.741 and weighted average of 4.6%, a difference of 3.6%.
Unemployment Among Ages 60 to 64 years Correlation Summary
| Measurement | Immigrants from Burma/Myanmar | British |
| Minimum | 0.70% | 3.1% |
| Maximum | 12.6% | 100.0% |
| Range | 11.9% | 96.9% |
| Mean | 4.8% | 18.8% |
| Median | 4.3% | 9.9% |
| Interquartile 25% (IQ1) | 3.6% | 5.5% |
| Interquartile 75% (IQ3) | 5.2% | 31.3% |
| Interquartile Range (IQR) | 1.6% | 25.8% |
| Standard Deviation (Sample) | 2.6% | 20.5% |
| Standard Deviation (Population) | 2.5% | 20.1% |
Similar Demographics by Unemployment Among Ages 60 to 64 years
Demographics Similar to Immigrants from Burma/Myanmar by Unemployment Among Ages 60 to 64 years
In terms of unemployment among ages 60 to 64 years, the demographic groups most similar to Immigrants from Burma/Myanmar are Immigrants from Zaire (4.4%, a difference of 0.23%), Cape Verdean (4.4%, a difference of 0.43%), Afghan (4.4%, a difference of 0.51%), Immigrants from Cabo Verde (4.4%, a difference of 0.51%), and Yugoslavian (4.4%, a difference of 0.64%).
| Demographics | Rating | Rank | Unemployment Among Ages 60 to 64 years |
| Immigrants | Afghanistan | 100.0 /100 | #17 | Exceptional 4.4% |
| Slovenes | 100.0 /100 | #18 | Exceptional 4.4% |
| Tsimshian | 100.0 /100 | #19 | Exceptional 4.4% |
| Afghans | 100.0 /100 | #20 | Exceptional 4.4% |
| Immigrants | Cabo Verde | 100.0 /100 | #21 | Exceptional 4.4% |
| Cape Verdeans | 100.0 /100 | #22 | Exceptional 4.4% |
| Immigrants | Zaire | 100.0 /100 | #23 | Exceptional 4.4% |
| Immigrants | Burma/Myanmar | 100.0 /100 | #24 | Exceptional 4.4% |
| Yugoslavians | 100.0 /100 | #25 | Exceptional 4.4% |
| Czechs | 100.0 /100 | #26 | Exceptional 4.4% |
| Immigrants | Iraq | 100.0 /100 | #27 | Exceptional 4.5% |
| Immigrants | Nepal | 100.0 /100 | #28 | Exceptional 4.5% |
| Cubans | 100.0 /100 | #29 | Exceptional 4.5% |
| Immigrants | Venezuela | 100.0 /100 | #30 | Exceptional 4.5% |
| Immigrants | Eritrea | 100.0 /100 | #31 | Exceptional 4.5% |
Demographics Similar to British by Unemployment Among Ages 60 to 64 years
In terms of unemployment among ages 60 to 64 years, the demographic groups most similar to British are Welsh (4.6%, a difference of 0.010%), Immigrants from India (4.6%, a difference of 0.050%), Bangladeshi (4.6%, a difference of 0.10%), Dutch (4.6%, a difference of 0.12%), and Immigrants from Moldova (4.6%, a difference of 0.15%).
| Demographics | Rating | Rank | Unemployment Among Ages 60 to 64 years |
| Scottish | 99.9 /100 | #50 | Exceptional 4.6% |
| Immigrants | Kenya | 99.9 /100 | #51 | Exceptional 4.6% |
| Kenyans | 99.9 /100 | #52 | Exceptional 4.6% |
| Immigrants | Moldova | 99.9 /100 | #53 | Exceptional 4.6% |
| Dutch | 99.9 /100 | #54 | Exceptional 4.6% |
| Bangladeshis | 99.9 /100 | #55 | Exceptional 4.6% |
| Welsh | 99.9 /100 | #56 | Exceptional 4.6% |
| British | 99.9 /100 | #57 | Exceptional 4.6% |
| Immigrants | India | 99.8 /100 | #58 | Exceptional 4.6% |
| Swiss | 99.8 /100 | #59 | Exceptional 4.6% |
| Puget Sound Salish | 99.8 /100 | #60 | Exceptional 4.6% |
| Lebanese | 99.8 /100 | #61 | Exceptional 4.6% |
| Senegalese | 99.7 /100 | #62 | Exceptional 4.6% |
| Czechoslovakians | 99.7 /100 | #63 | Exceptional 4.6% |
| Immigrants | Middle Africa | 99.7 /100 | #64 | Exceptional 4.6% |