Immigrants from Burma/Myanmar vs British Disability Age 18 to 34
COMPARE
Immigrants from Burma/Myanmar
British
Disability Age 18 to 34
Disability Age 18 to 34 Comparison
Immigrants from Burma/Myanmar
British
6.8%
DISABILITY AGE 18 TO 34
12.3/ 100
METRIC RATING
209th/ 347
METRIC RANK
7.3%
DISABILITY AGE 18 TO 34
0.2/ 100
METRIC RATING
263rd/ 347
METRIC RANK
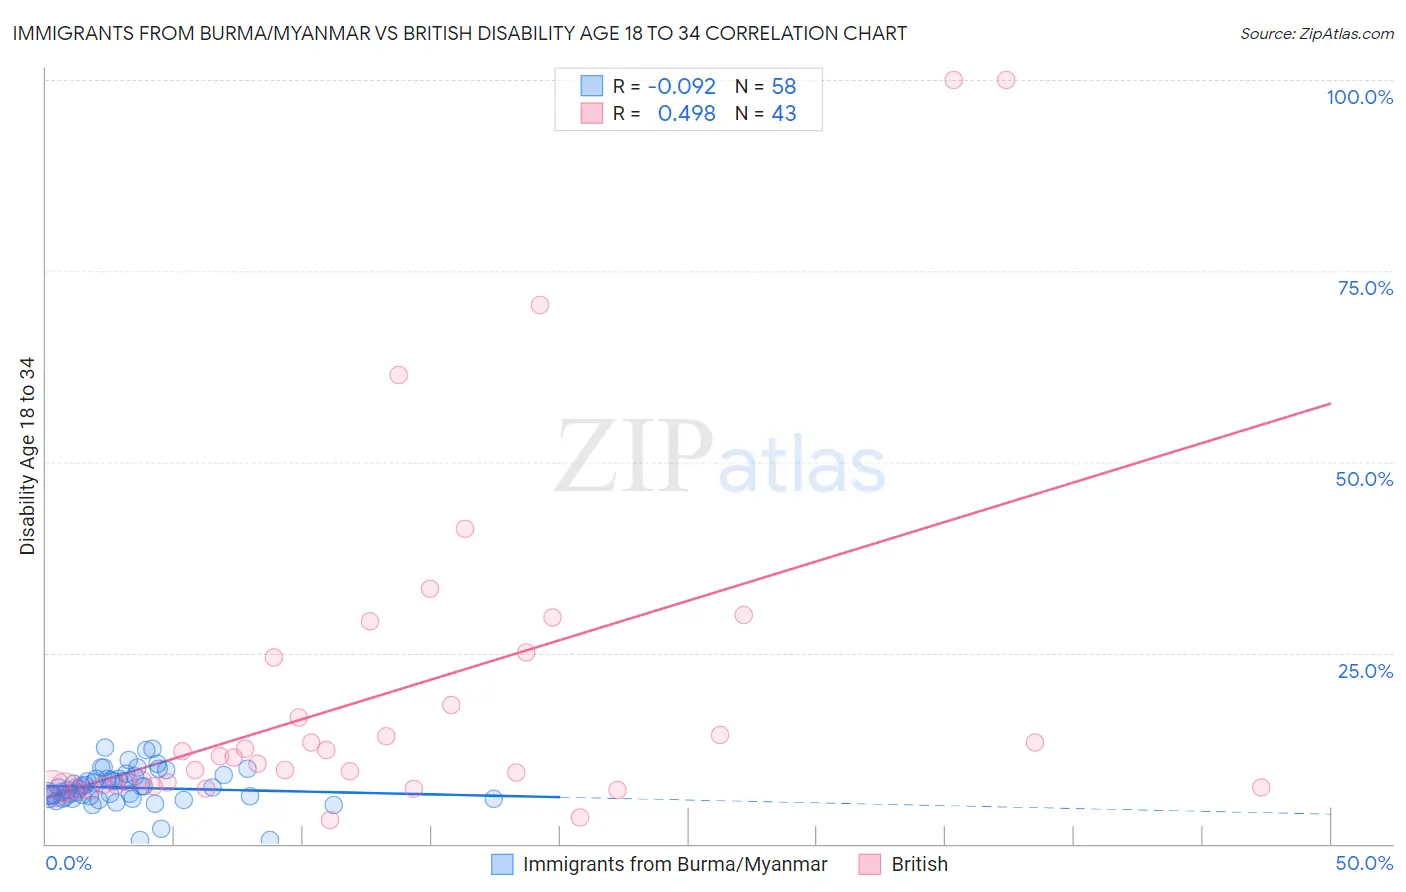
Immigrants from Burma/Myanmar vs British Disability Age 18 to 34 Correlation Chart
The statistical analysis conducted on geographies consisting of 172,278,833 people shows a slight negative correlation between the proportion of Immigrants from Burma/Myanmar and percentage of population with a disability between the ages 18 and 35 in the United States with a correlation coefficient (R) of -0.092 and weighted average of 6.8%. Similarly, the statistical analysis conducted on geographies consisting of 528,221,956 people shows a moderate positive correlation between the proportion of British and percentage of population with a disability between the ages 18 and 35 in the United States with a correlation coefficient (R) of 0.498 and weighted average of 7.3%, a difference of 7.4%.
Disability Age 18 to 34 Correlation Summary
| Measurement | Immigrants from Burma/Myanmar | British |
| Minimum | 0.44% | 3.0% |
| Maximum | 12.7% | 100.0% |
| Range | 12.2% | 97.0% |
| Mean | 7.3% | 19.9% |
| Median | 7.2% | 11.2% |
| Interquartile 25% (IQ1) | 6.0% | 7.5% |
| Interquartile 75% (IQ3) | 8.5% | 24.4% |
| Interquartile Range (IQR) | 2.5% | 16.9% |
| Standard Deviation (Sample) | 2.4% | 22.8% |
| Standard Deviation (Population) | 2.4% | 22.5% |
Similar Demographics by Disability Age 18 to 34
Demographics Similar to Immigrants from Burma/Myanmar by Disability Age 18 to 34
In terms of disability age 18 to 34, the demographic groups most similar to Immigrants from Burma/Myanmar are Immigrants from Scotland (6.8%, a difference of 0.020%), Mexican (6.8%, a difference of 0.040%), Japanese (6.8%, a difference of 0.080%), Lebanese (6.8%, a difference of 0.15%), and Immigrants from Bosnia and Herzegovina (6.8%, a difference of 0.20%).
| Demographics | Rating | Rank | Disability Age 18 to 34 |
| Panamanians | 15.8 /100 | #202 | Poor 6.8% |
| Hispanics or Latinos | 13.8 /100 | #203 | Poor 6.8% |
| Immigrants | Bosnia and Herzegovina | 13.6 /100 | #204 | Poor 6.8% |
| Lebanese | 13.3 /100 | #205 | Poor 6.8% |
| Japanese | 12.8 /100 | #206 | Poor 6.8% |
| Mexicans | 12.6 /100 | #207 | Poor 6.8% |
| Immigrants | Scotland | 12.4 /100 | #208 | Poor 6.8% |
| Immigrants | Burma/Myanmar | 12.3 /100 | #209 | Poor 6.8% |
| Latvians | 11.1 /100 | #210 | Poor 6.8% |
| Immigrants | Norway | 10.0 /100 | #211 | Tragic 6.8% |
| Luxembourgers | 9.4 /100 | #212 | Tragic 6.9% |
| Immigrants | Western Europe | 9.1 /100 | #213 | Tragic 6.9% |
| Serbians | 8.2 /100 | #214 | Tragic 6.9% |
| Immigrants | Thailand | 7.5 /100 | #215 | Tragic 6.9% |
| Sudanese | 7.0 /100 | #216 | Tragic 6.9% |
Demographics Similar to British by Disability Age 18 to 34
In terms of disability age 18 to 34, the demographic groups most similar to British are Bermudan (7.3%, a difference of 0.25%), Slovene (7.3%, a difference of 0.28%), Canadian (7.3%, a difference of 0.29%), Northern European (7.3%, a difference of 0.32%), and German Russian (7.4%, a difference of 0.44%).
| Demographics | Rating | Rank | Disability Age 18 to 34 |
| Immigrants | Laos | 0.4 /100 | #256 | Tragic 7.2% |
| Czechs | 0.3 /100 | #257 | Tragic 7.2% |
| Immigrants | Micronesia | 0.3 /100 | #258 | Tragic 7.3% |
| Somalis | 0.2 /100 | #259 | Tragic 7.3% |
| Tohono O'odham | 0.2 /100 | #260 | Tragic 7.3% |
| Northern Europeans | 0.2 /100 | #261 | Tragic 7.3% |
| Canadians | 0.2 /100 | #262 | Tragic 7.3% |
| British | 0.2 /100 | #263 | Tragic 7.3% |
| Bermudans | 0.1 /100 | #264 | Tragic 7.3% |
| Slovenes | 0.1 /100 | #265 | Tragic 7.3% |
| German Russians | 0.1 /100 | #266 | Tragic 7.4% |
| Bangladeshis | 0.1 /100 | #267 | Tragic 7.4% |
| Portuguese | 0.1 /100 | #268 | Tragic 7.4% |
| Basques | 0.1 /100 | #269 | Tragic 7.4% |
| Belgians | 0.1 /100 | #270 | Tragic 7.4% |