Immigrants from Uganda vs Bahamian 12th Grade, No Diploma
COMPARE
Immigrants from Uganda
Bahamian
12th Grade, No Diploma
12th Grade, No Diploma Comparison
Immigrants from Uganda
Bahamians
90.9%
12TH GRADE, NO DIPLOMA
31.6/ 100
METRIC RATING
189th/ 347
METRIC RANK
89.9%
12TH GRADE, NO DIPLOMA
0.9/ 100
METRIC RATING
252nd/ 347
METRIC RANK
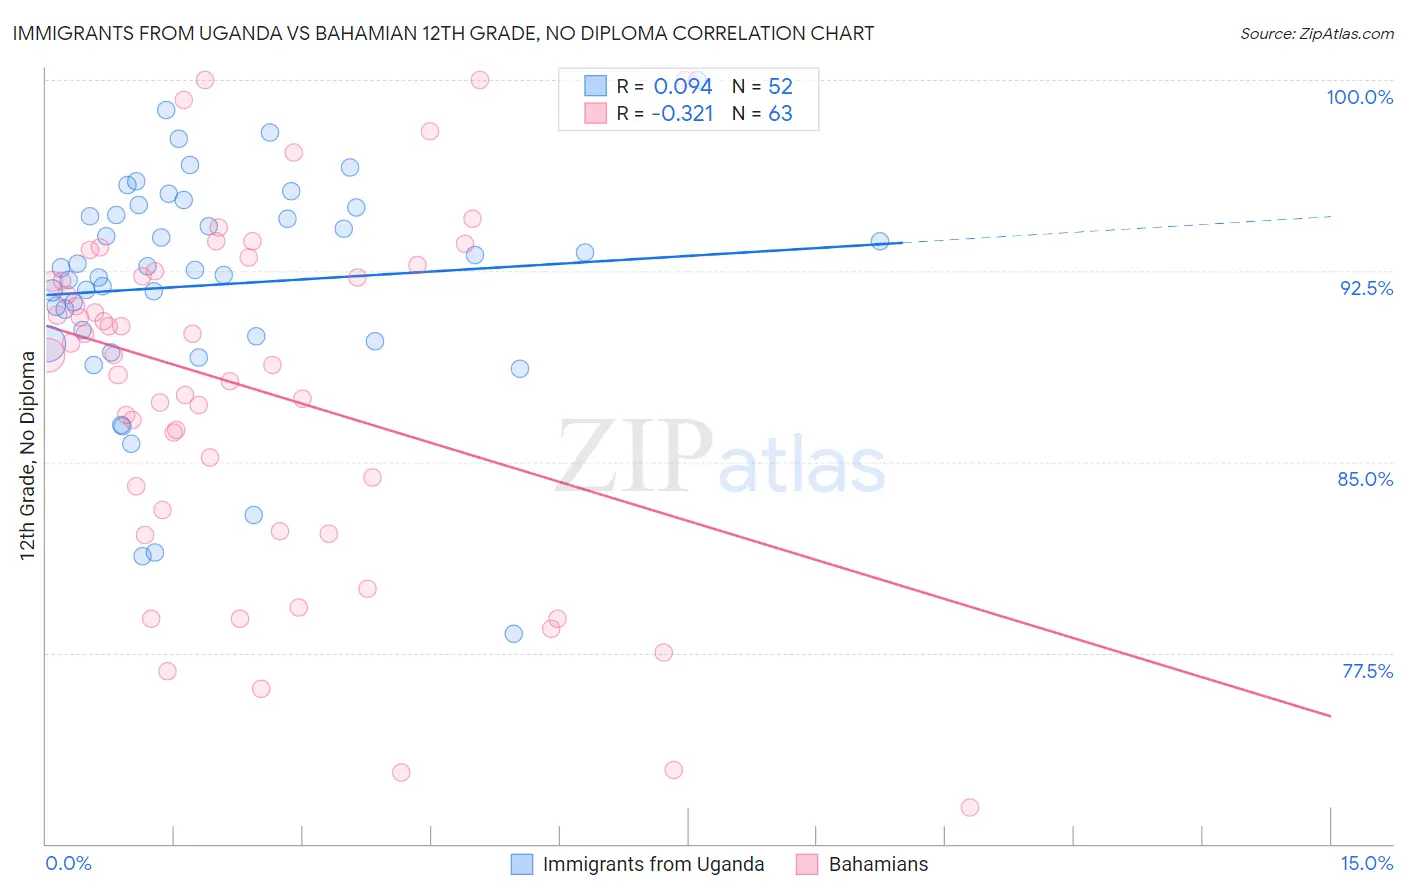
Immigrants from Uganda vs Bahamian 12th Grade, No Diploma Correlation Chart
The statistical analysis conducted on geographies consisting of 125,969,169 people shows a slight positive correlation between the proportion of Immigrants from Uganda and percentage of population with at least 12th grade (no diploma) education in the United States with a correlation coefficient (R) of 0.094 and weighted average of 90.9%. Similarly, the statistical analysis conducted on geographies consisting of 112,698,819 people shows a mild negative correlation between the proportion of Bahamians and percentage of population with at least 12th grade (no diploma) education in the United States with a correlation coefficient (R) of -0.321 and weighted average of 89.9%, a difference of 1.2%.
12th Grade, No Diploma Correlation Summary
| Measurement | Immigrants from Uganda | Bahamian |
| Minimum | 78.2% | 71.4% |
| Maximum | 100.0% | 100.0% |
| Range | 21.8% | 28.6% |
| Mean | 92.0% | 87.9% |
| Median | 92.6% | 89.2% |
| Interquartile 25% (IQ1) | 89.9% | 83.1% |
| Interquartile 75% (IQ3) | 94.9% | 92.5% |
| Interquartile Range (IQR) | 5.0% | 9.4% |
| Standard Deviation (Sample) | 4.4% | 6.9% |
| Standard Deviation (Population) | 4.4% | 6.9% |
Similar Demographics by 12th Grade, No Diploma
Demographics Similar to Immigrants from Uganda by 12th Grade, No Diploma
In terms of 12th grade, no diploma, the demographic groups most similar to Immigrants from Uganda are American (91.0%, a difference of 0.010%), Potawatomi (91.0%, a difference of 0.020%), Ethiopian (91.0%, a difference of 0.030%), Afghan (90.9%, a difference of 0.030%), and Sudanese (91.0%, a difference of 0.040%).
| Demographics | Rating | Rank | 12th Grade, No Diploma |
| Immigrants | Nonimmigrants | 38.8 /100 | #182 | Fair 91.0% |
| Osage | 38.3 /100 | #183 | Fair 91.0% |
| Spaniards | 36.2 /100 | #184 | Fair 91.0% |
| Sudanese | 34.4 /100 | #185 | Fair 91.0% |
| Ethiopians | 33.9 /100 | #186 | Fair 91.0% |
| Potawatomi | 32.9 /100 | #187 | Fair 91.0% |
| Americans | 32.6 /100 | #188 | Fair 91.0% |
| Immigrants | Uganda | 31.6 /100 | #189 | Fair 90.9% |
| Afghans | 29.9 /100 | #190 | Fair 90.9% |
| Moroccans | 28.8 /100 | #191 | Fair 90.9% |
| Immigrants | Eastern Africa | 27.7 /100 | #192 | Fair 90.9% |
| Immigrants | Ethiopia | 27.2 /100 | #193 | Fair 90.9% |
| Immigrants | Oceania | 26.0 /100 | #194 | Fair 90.9% |
| Koreans | 24.5 /100 | #195 | Fair 90.8% |
| Panamanians | 22.8 /100 | #196 | Fair 90.8% |
Demographics Similar to Bahamians by 12th Grade, No Diploma
In terms of 12th grade, no diploma, the demographic groups most similar to Bahamians are Spanish American (89.9%, a difference of 0.0%), Immigrants from Eritrea (89.9%, a difference of 0.010%), Comanche (89.9%, a difference of 0.050%), Senegalese (89.9%, a difference of 0.050%), and Choctaw (89.8%, a difference of 0.080%).
| Demographics | Rating | Rank | 12th Grade, No Diploma |
| Immigrants | Uruguay | 1.4 /100 | #245 | Tragic 90.0% |
| Ghanaians | 1.3 /100 | #246 | Tragic 90.0% |
| Immigrants | Nigeria | 1.3 /100 | #247 | Tragic 89.9% |
| Comanche | 1.1 /100 | #248 | Tragic 89.9% |
| Senegalese | 1.1 /100 | #249 | Tragic 89.9% |
| Immigrants | Eritrea | 1.0 /100 | #250 | Tragic 89.9% |
| Spanish Americans | 0.9 /100 | #251 | Tragic 89.9% |
| Bahamians | 0.9 /100 | #252 | Tragic 89.9% |
| Choctaw | 0.7 /100 | #253 | Tragic 89.8% |
| Immigrants | Peru | 0.5 /100 | #254 | Tragic 89.7% |
| Immigrants | Senegal | 0.5 /100 | #255 | Tragic 89.7% |
| Immigrants | Ghana | 0.5 /100 | #256 | Tragic 89.7% |
| Jamaicans | 0.5 /100 | #257 | Tragic 89.7% |
| Africans | 0.4 /100 | #258 | Tragic 89.6% |
| Immigrants | Western Africa | 0.4 /100 | #259 | Tragic 89.6% |