Immigrants from Bulgaria vs Polish Professional Degree
COMPARE
Immigrants from Bulgaria
Polish
Professional Degree
Professional Degree Comparison
Immigrants from Bulgaria
Poles
5.5%
PROFESSIONAL DEGREE
99.9/ 100
METRIC RATING
67th/ 347
METRIC RANK
4.6%
PROFESSIONAL DEGREE
72.6/ 100
METRIC RATING
151st/ 347
METRIC RANK
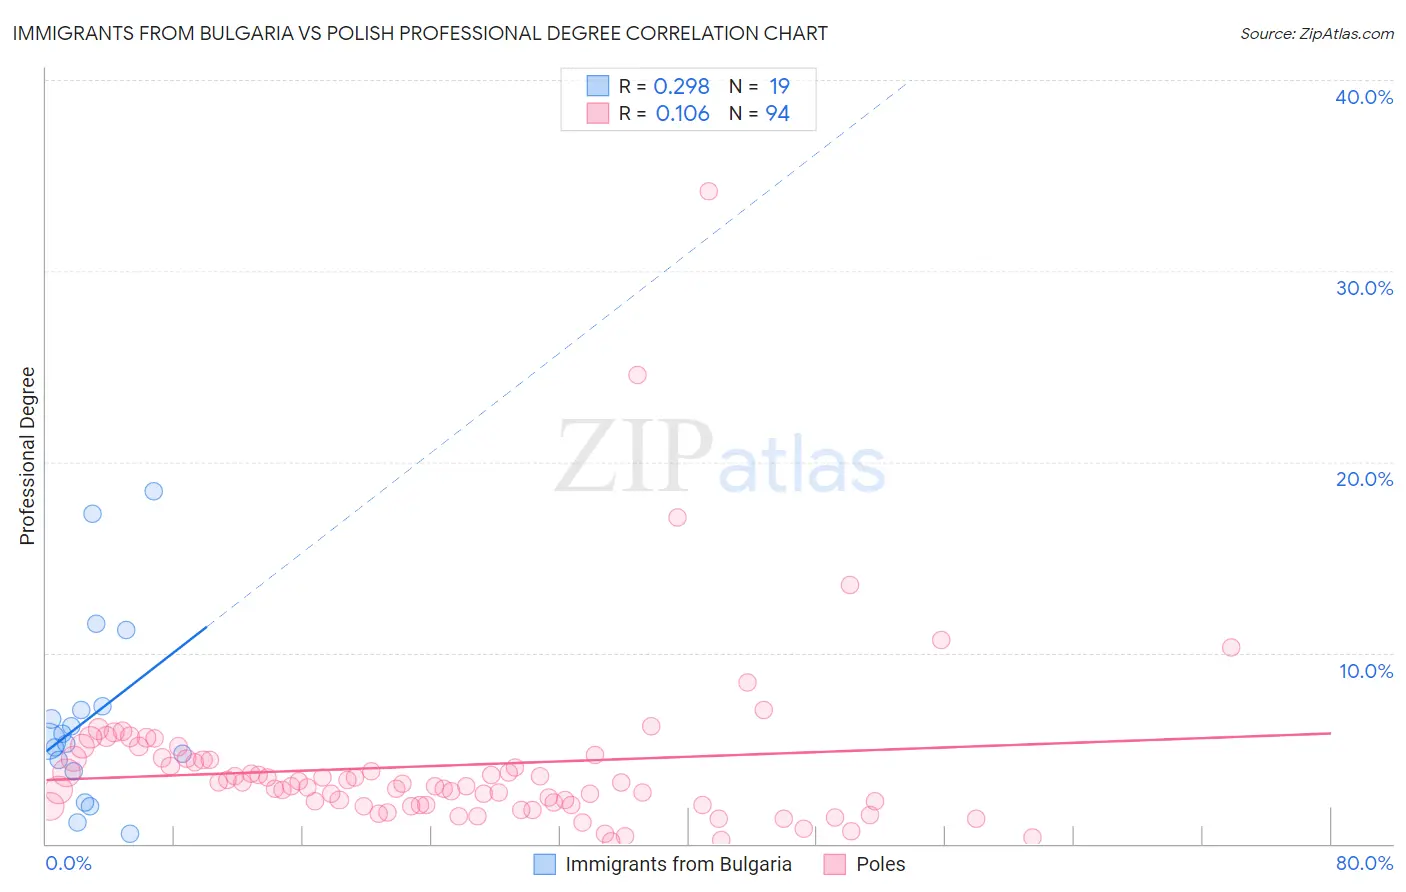
Immigrants from Bulgaria vs Polish Professional Degree Correlation Chart
The statistical analysis conducted on geographies consisting of 172,510,370 people shows a weak positive correlation between the proportion of Immigrants from Bulgaria and percentage of population with at least professional degree education in the United States with a correlation coefficient (R) of 0.298 and weighted average of 5.5%. Similarly, the statistical analysis conducted on geographies consisting of 553,734,682 people shows a poor positive correlation between the proportion of Poles and percentage of population with at least professional degree education in the United States with a correlation coefficient (R) of 0.106 and weighted average of 4.6%, a difference of 19.9%.
Professional Degree Correlation Summary
| Measurement | Immigrants from Bulgaria | Polish |
| Minimum | 0.51% | 0.12% |
| Maximum | 18.5% | 34.2% |
| Range | 18.0% | 34.0% |
| Mean | 6.6% | 4.1% |
| Median | 5.4% | 3.1% |
| Interquartile 25% (IQ1) | 3.8% | 2.0% |
| Interquartile 75% (IQ3) | 7.2% | 4.4% |
| Interquartile Range (IQR) | 3.4% | 2.4% |
| Standard Deviation (Sample) | 4.9% | 4.6% |
| Standard Deviation (Population) | 4.8% | 4.6% |
Similar Demographics by Professional Degree
Demographics Similar to Immigrants from Bulgaria by Professional Degree
In terms of professional degree, the demographic groups most similar to Immigrants from Bulgaria are Immigrants from Lebanon (5.5%, a difference of 0.18%), Immigrants from Hungary (5.5%, a difference of 0.26%), Immigrants from Kazakhstan (5.5%, a difference of 0.32%), Immigrants from Bolivia (5.5%, a difference of 0.56%), and Bhutanese (5.4%, a difference of 0.59%).
| Demographics | Rating | Rank | Professional Degree |
| Bolivians | 99.9 /100 | #60 | Exceptional 5.6% |
| Immigrants | Lithuania | 99.9 /100 | #61 | Exceptional 5.6% |
| Immigrants | Belarus | 99.9 /100 | #62 | Exceptional 5.5% |
| Asians | 99.9 /100 | #63 | Exceptional 5.5% |
| Immigrants | Asia | 99.9 /100 | #64 | Exceptional 5.5% |
| Immigrants | Bolivia | 99.9 /100 | #65 | Exceptional 5.5% |
| Immigrants | Kazakhstan | 99.9 /100 | #66 | Exceptional 5.5% |
| Immigrants | Bulgaria | 99.9 /100 | #67 | Exceptional 5.5% |
| Immigrants | Lebanon | 99.9 /100 | #68 | Exceptional 5.5% |
| Immigrants | Hungary | 99.9 /100 | #69 | Exceptional 5.5% |
| Bhutanese | 99.8 /100 | #70 | Exceptional 5.4% |
| Immigrants | Western Asia | 99.8 /100 | #71 | Exceptional 5.4% |
| Lithuanians | 99.8 /100 | #72 | Exceptional 5.4% |
| Immigrants | Romania | 99.8 /100 | #73 | Exceptional 5.4% |
| Ethiopians | 99.7 /100 | #74 | Exceptional 5.4% |
Demographics Similar to Poles by Professional Degree
In terms of professional degree, the demographic groups most similar to Poles are Immigrants from Africa (4.6%, a difference of 0.010%), Immigrants from Uruguay (4.6%, a difference of 0.020%), Immigrants from Oceania (4.6%, a difference of 0.14%), Scottish (4.6%, a difference of 0.14%), and Slavic (4.5%, a difference of 0.31%).
| Demographics | Rating | Rank | Professional Degree |
| Immigrants | South America | 80.5 /100 | #144 | Excellent 4.6% |
| Uruguayans | 80.2 /100 | #145 | Excellent 4.6% |
| Luxembourgers | 78.7 /100 | #146 | Good 4.6% |
| Colombians | 77.7 /100 | #147 | Good 4.6% |
| Slovenes | 76.1 /100 | #148 | Good 4.6% |
| Senegalese | 75.3 /100 | #149 | Good 4.6% |
| Immigrants | Oceania | 73.4 /100 | #150 | Good 4.6% |
| Poles | 72.6 /100 | #151 | Good 4.6% |
| Immigrants | Africa | 72.5 /100 | #152 | Good 4.6% |
| Immigrants | Uruguay | 72.5 /100 | #153 | Good 4.6% |
| Scottish | 71.8 /100 | #154 | Good 4.6% |
| Slavs | 70.8 /100 | #155 | Good 4.5% |
| Swedes | 69.9 /100 | #156 | Good 4.5% |
| Iraqis | 69.8 /100 | #157 | Good 4.5% |
| Immigrants | Armenia | 68.8 /100 | #158 | Good 4.5% |