Immigrants from Serbia vs Danish College, 1 year or more
COMPARE
Immigrants from Serbia
Danish
College, 1 year or more
College, 1 year or more Comparison
Immigrants from Serbia
Danes
63.8%
COLLEGE, 1 YEAR OR MORE
99.6/ 100
METRIC RATING
59th/ 347
METRIC RANK
61.7%
COLLEGE, 1 YEAR OR MORE
94.8/ 100
METRIC RATING
114th/ 347
METRIC RANK
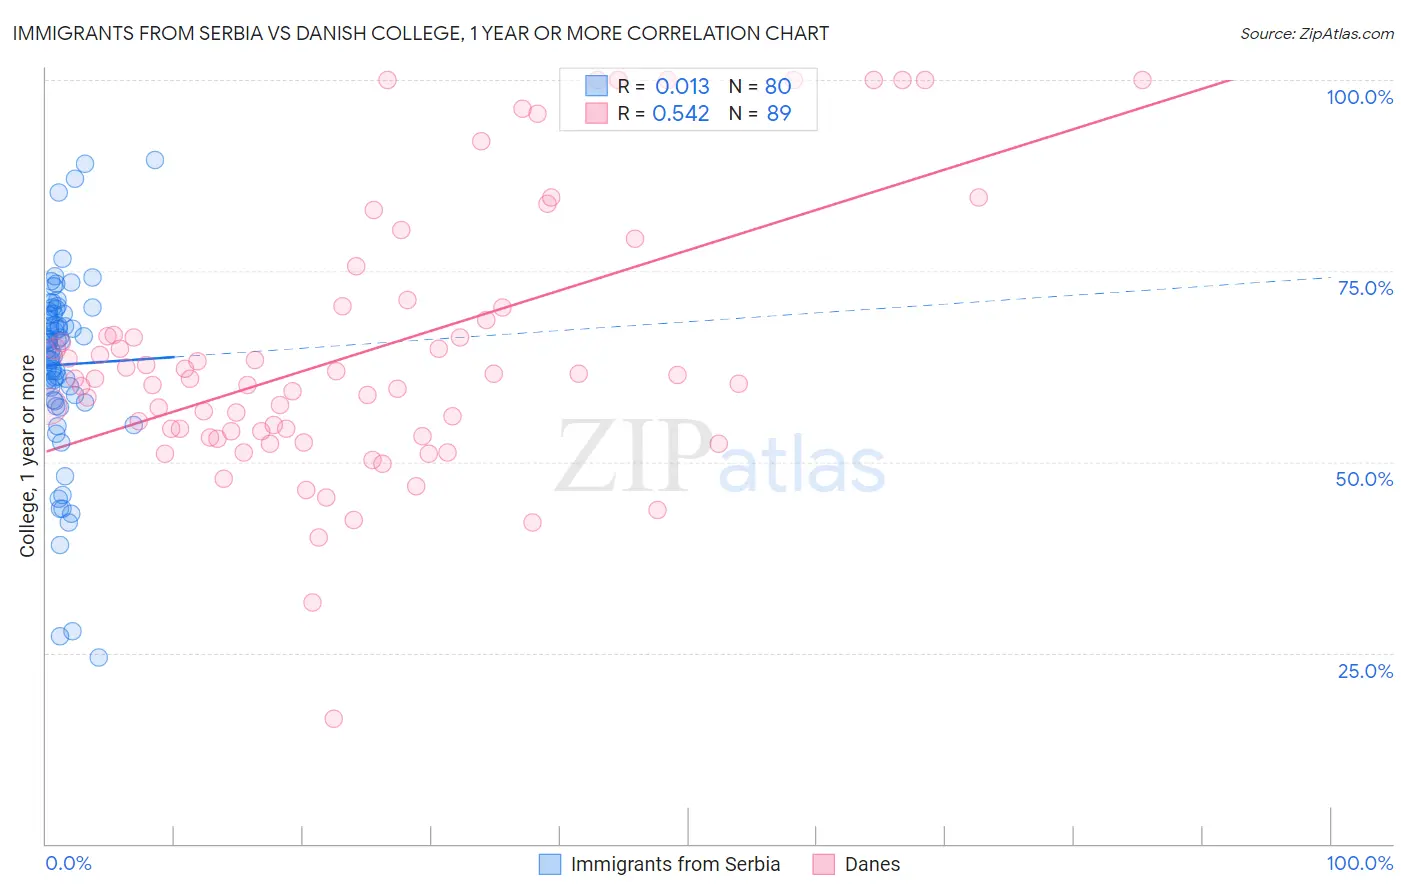
Immigrants from Serbia vs Danish College, 1 year or more Correlation Chart
The statistical analysis conducted on geographies consisting of 131,742,963 people shows no correlation between the proportion of Immigrants from Serbia and percentage of population with at least college, 1 year or more education in the United States with a correlation coefficient (R) of 0.013 and weighted average of 63.8%. Similarly, the statistical analysis conducted on geographies consisting of 474,193,590 people shows a substantial positive correlation between the proportion of Danes and percentage of population with at least college, 1 year or more education in the United States with a correlation coefficient (R) of 0.542 and weighted average of 61.7%, a difference of 3.4%.
College, 1 year or more Correlation Summary
| Measurement | Immigrants from Serbia | Danish |
| Minimum | 24.3% | 16.4% |
| Maximum | 89.5% | 100.0% |
| Range | 65.1% | 83.6% |
| Mean | 62.7% | 64.6% |
| Median | 65.2% | 60.9% |
| Interquartile 25% (IQ1) | 58.5% | 53.6% |
| Interquartile 75% (IQ3) | 69.4% | 70.3% |
| Interquartile Range (IQR) | 11.0% | 16.7% |
| Standard Deviation (Sample) | 12.2% | 17.7% |
| Standard Deviation (Population) | 12.1% | 17.6% |
Similar Demographics by College, 1 year or more
Demographics Similar to Immigrants from Serbia by College, 1 year or more
In terms of college, 1 year or more, the demographic groups most similar to Immigrants from Serbia are Immigrants from Kazakhstan (63.6%, a difference of 0.27%), Immigrants from Asia (64.0%, a difference of 0.35%), Bolivian (63.5%, a difference of 0.38%), Immigrants from Indonesia (63.5%, a difference of 0.39%), and South African (64.1%, a difference of 0.49%).
| Demographics | Rating | Rank | College, 1 year or more |
| Immigrants | Netherlands | 99.8 /100 | #52 | Exceptional 64.2% |
| Asians | 99.8 /100 | #53 | Exceptional 64.2% |
| Zimbabweans | 99.8 /100 | #54 | Exceptional 64.2% |
| Immigrants | Belarus | 99.7 /100 | #55 | Exceptional 64.1% |
| Immigrants | Czechoslovakia | 99.7 /100 | #56 | Exceptional 64.1% |
| South Africans | 99.7 /100 | #57 | Exceptional 64.1% |
| Immigrants | Asia | 99.7 /100 | #58 | Exceptional 64.0% |
| Immigrants | Serbia | 99.6 /100 | #59 | Exceptional 63.8% |
| Immigrants | Kazakhstan | 99.5 /100 | #60 | Exceptional 63.6% |
| Bolivians | 99.5 /100 | #61 | Exceptional 63.5% |
| Immigrants | Indonesia | 99.5 /100 | #62 | Exceptional 63.5% |
| Immigrants | Scotland | 99.4 /100 | #63 | Exceptional 63.4% |
| Immigrants | Spain | 99.4 /100 | #64 | Exceptional 63.4% |
| Maltese | 99.3 /100 | #65 | Exceptional 63.4% |
| Immigrants | Europe | 99.3 /100 | #66 | Exceptional 63.3% |
Demographics Similar to Danes by College, 1 year or more
In terms of college, 1 year or more, the demographic groups most similar to Danes are Norwegian (61.7%, a difference of 0.070%), Ukrainian (61.8%, a difference of 0.11%), Lebanese (61.6%, a difference of 0.17%), Austrian (61.8%, a difference of 0.18%), and Arab (61.6%, a difference of 0.21%).
| Demographics | Rating | Rank | College, 1 year or more |
| Immigrants | Ukraine | 95.8 /100 | #107 | Exceptional 61.9% |
| Syrians | 95.7 /100 | #108 | Exceptional 61.9% |
| Immigrants | Northern Africa | 95.7 /100 | #109 | Exceptional 61.9% |
| Europeans | 95.6 /100 | #110 | Exceptional 61.8% |
| Macedonians | 95.6 /100 | #111 | Exceptional 61.8% |
| Austrians | 95.4 /100 | #112 | Exceptional 61.8% |
| Ukrainians | 95.2 /100 | #113 | Exceptional 61.8% |
| Danes | 94.8 /100 | #114 | Exceptional 61.7% |
| Norwegians | 94.5 /100 | #115 | Exceptional 61.7% |
| Lebanese | 94.1 /100 | #116 | Exceptional 61.6% |
| Arabs | 93.9 /100 | #117 | Exceptional 61.6% |
| Immigrants | Brazil | 93.9 /100 | #118 | Exceptional 61.6% |
| Assyrians/Chaldeans/Syriacs | 93.3 /100 | #119 | Exceptional 61.5% |
| Pakistanis | 93.2 /100 | #120 | Exceptional 61.5% |
| Immigrants | Jordan | 92.7 /100 | #121 | Exceptional 61.4% |