Immigrants vs Danish College, 1 year or more
COMPARE
Immigrants
Danish
College, 1 year or more
College, 1 year or more Comparison
Immigrants
Danes
57.0%
COLLEGE, 1 YEAR OR MORE
4.4/ 100
METRIC RATING
227th/ 347
METRIC RANK
61.7%
COLLEGE, 1 YEAR OR MORE
94.8/ 100
METRIC RATING
114th/ 347
METRIC RANK
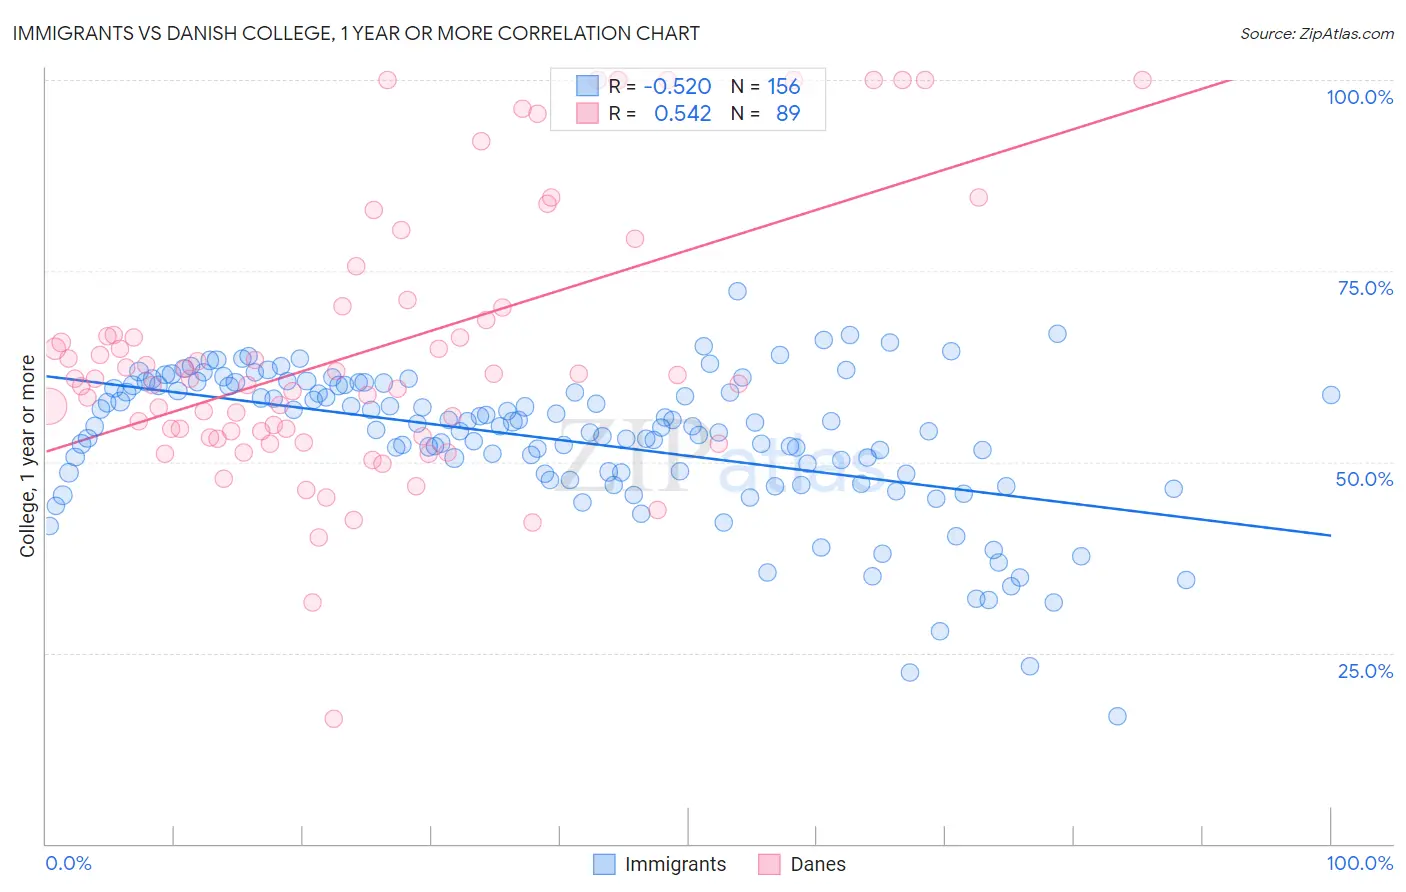
Immigrants vs Danish College, 1 year or more Correlation Chart
The statistical analysis conducted on geographies consisting of 577,748,895 people shows a substantial negative correlation between the proportion of Immigrants and percentage of population with at least college, 1 year or more education in the United States with a correlation coefficient (R) of -0.520 and weighted average of 57.0%. Similarly, the statistical analysis conducted on geographies consisting of 474,193,590 people shows a substantial positive correlation between the proportion of Danes and percentage of population with at least college, 1 year or more education in the United States with a correlation coefficient (R) of 0.542 and weighted average of 61.7%, a difference of 8.3%.
College, 1 year or more Correlation Summary
| Measurement | Immigrants | Danish |
| Minimum | 16.7% | 16.4% |
| Maximum | 72.4% | 100.0% |
| Range | 55.7% | 83.6% |
| Mean | 52.9% | 64.6% |
| Median | 54.7% | 60.9% |
| Interquartile 25% (IQ1) | 48.5% | 53.6% |
| Interquartile 75% (IQ3) | 60.0% | 70.3% |
| Interquartile Range (IQR) | 11.5% | 16.7% |
| Standard Deviation (Sample) | 9.5% | 17.7% |
| Standard Deviation (Population) | 9.5% | 17.6% |
Similar Demographics by College, 1 year or more
Demographics Similar to Immigrants by College, 1 year or more
In terms of college, 1 year or more, the demographic groups most similar to Immigrants are Immigrants from Western Africa (57.0%, a difference of 0.070%), Vietnamese (57.0%, a difference of 0.090%), Immigrants from Fiji (56.9%, a difference of 0.15%), Cree (56.8%, a difference of 0.28%), and Portuguese (57.2%, a difference of 0.30%).
| Demographics | Rating | Rank | College, 1 year or more |
| Immigrants | Costa Rica | 8.0 /100 | #220 | Tragic 57.5% |
| Immigrants | Ghana | 7.7 /100 | #221 | Tragic 57.4% |
| Sub-Saharan Africans | 6.1 /100 | #222 | Tragic 57.3% |
| Portuguese | 5.4 /100 | #223 | Tragic 57.2% |
| Hmong | 5.4 /100 | #224 | Tragic 57.2% |
| Vietnamese | 4.7 /100 | #225 | Tragic 57.0% |
| Immigrants | Western Africa | 4.6 /100 | #226 | Tragic 57.0% |
| Immigrants | Immigrants | 4.4 /100 | #227 | Tragic 57.0% |
| Immigrants | Fiji | 4.0 /100 | #228 | Tragic 56.9% |
| Cree | 3.6 /100 | #229 | Tragic 56.8% |
| Liberians | 3.1 /100 | #230 | Tragic 56.7% |
| Immigrants | Burma/Myanmar | 2.7 /100 | #231 | Tragic 56.6% |
| Immigrants | Bangladesh | 2.6 /100 | #232 | Tragic 56.6% |
| Immigrants | Nonimmigrants | 2.5 /100 | #233 | Tragic 56.5% |
| Spanish Americans | 1.8 /100 | #234 | Tragic 56.3% |
Demographics Similar to Danes by College, 1 year or more
In terms of college, 1 year or more, the demographic groups most similar to Danes are Norwegian (61.7%, a difference of 0.070%), Ukrainian (61.8%, a difference of 0.11%), Lebanese (61.6%, a difference of 0.17%), Austrian (61.8%, a difference of 0.18%), and Arab (61.6%, a difference of 0.21%).
| Demographics | Rating | Rank | College, 1 year or more |
| Immigrants | Ukraine | 95.8 /100 | #107 | Exceptional 61.9% |
| Syrians | 95.7 /100 | #108 | Exceptional 61.9% |
| Immigrants | Northern Africa | 95.7 /100 | #109 | Exceptional 61.9% |
| Europeans | 95.6 /100 | #110 | Exceptional 61.8% |
| Macedonians | 95.6 /100 | #111 | Exceptional 61.8% |
| Austrians | 95.4 /100 | #112 | Exceptional 61.8% |
| Ukrainians | 95.2 /100 | #113 | Exceptional 61.8% |
| Danes | 94.8 /100 | #114 | Exceptional 61.7% |
| Norwegians | 94.5 /100 | #115 | Exceptional 61.7% |
| Lebanese | 94.1 /100 | #116 | Exceptional 61.6% |
| Arabs | 93.9 /100 | #117 | Exceptional 61.6% |
| Immigrants | Brazil | 93.9 /100 | #118 | Exceptional 61.6% |
| Assyrians/Chaldeans/Syriacs | 93.3 /100 | #119 | Exceptional 61.5% |
| Pakistanis | 93.2 /100 | #120 | Exceptional 61.5% |
| Immigrants | Jordan | 92.7 /100 | #121 | Exceptional 61.4% |