Immigrants from Brazil vs Ukrainian Bachelor's Degree
COMPARE
Immigrants from Brazil
Ukrainian
Bachelor's Degree
Bachelor's Degree Comparison
Immigrants from Brazil
Ukrainians
42.2%
BACHELOR'S DEGREE
99.2/ 100
METRIC RATING
86th/ 347
METRIC RANK
40.9%
BACHELOR'S DEGREE
96.6/ 100
METRIC RATING
108th/ 347
METRIC RANK
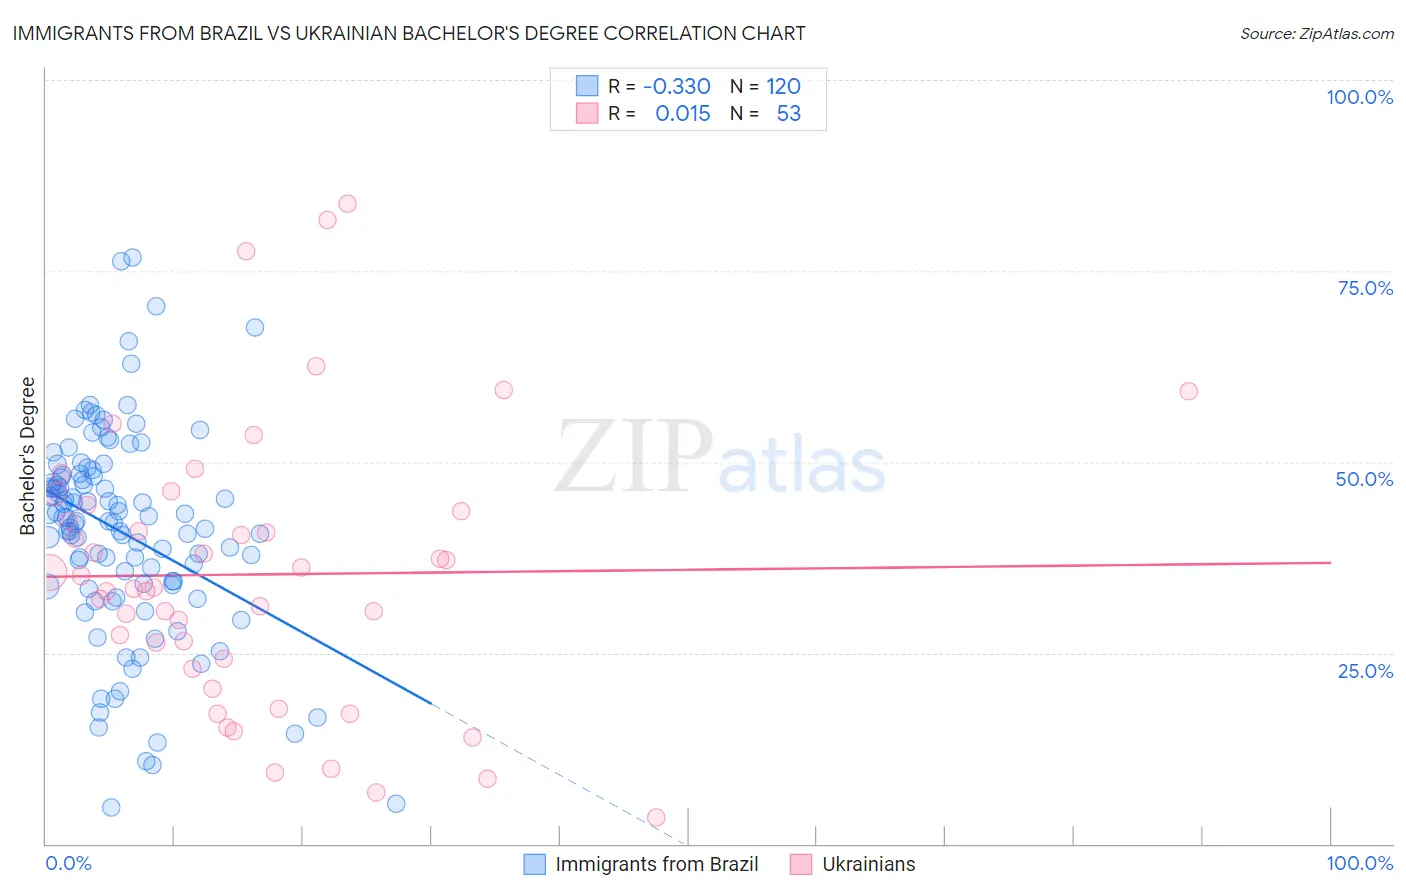
Immigrants from Brazil vs Ukrainian Bachelor's Degree Correlation Chart
The statistical analysis conducted on geographies consisting of 342,997,196 people shows a mild negative correlation between the proportion of Immigrants from Brazil and percentage of population with at least bachelor's degree education in the United States with a correlation coefficient (R) of -0.330 and weighted average of 42.2%. Similarly, the statistical analysis conducted on geographies consisting of 448,644,466 people shows no correlation between the proportion of Ukrainians and percentage of population with at least bachelor's degree education in the United States with a correlation coefficient (R) of 0.015 and weighted average of 40.9%, a difference of 3.2%.
Bachelor's Degree Correlation Summary
| Measurement | Immigrants from Brazil | Ukrainian |
| Minimum | 4.8% | 3.4% |
| Maximum | 76.8% | 83.8% |
| Range | 72.0% | 80.3% |
| Mean | 40.8% | 35.3% |
| Median | 42.2% | 33.6% |
| Interquartile 25% (IQ1) | 33.9% | 23.6% |
| Interquartile 75% (IQ3) | 48.3% | 43.9% |
| Interquartile Range (IQR) | 14.3% | 20.3% |
| Standard Deviation (Sample) | 13.5% | 18.0% |
| Standard Deviation (Population) | 13.5% | 17.8% |
Similar Demographics by Bachelor's Degree
Demographics Similar to Immigrants from Brazil by Bachelor's Degree
In terms of bachelor's degree, the demographic groups most similar to Immigrants from Brazil are Lithuanian (42.2%, a difference of 0.080%), Immigrants from Western Asia (42.3%, a difference of 0.11%), Armenian (42.3%, a difference of 0.12%), Immigrants from Scotland (42.3%, a difference of 0.15%), and Immigrants from Hungary (42.3%, a difference of 0.22%).
| Demographics | Rating | Rank | Bachelor's Degree |
| Immigrants | Lebanon | 99.3 /100 | #79 | Exceptional 42.4% |
| Immigrants | Croatia | 99.2 /100 | #80 | Exceptional 42.3% |
| Immigrants | Hungary | 99.2 /100 | #81 | Exceptional 42.3% |
| Immigrants | Scotland | 99.2 /100 | #82 | Exceptional 42.3% |
| Armenians | 99.2 /100 | #83 | Exceptional 42.3% |
| Immigrants | Western Asia | 99.2 /100 | #84 | Exceptional 42.3% |
| Lithuanians | 99.2 /100 | #85 | Exceptional 42.2% |
| Immigrants | Brazil | 99.2 /100 | #86 | Exceptional 42.2% |
| Carpatho Rusyns | 99.0 /100 | #87 | Exceptional 42.1% |
| Immigrants | Western Europe | 99.0 /100 | #88 | Exceptional 42.0% |
| Greeks | 99.0 /100 | #89 | Exceptional 42.0% |
| Laotians | 98.9 /100 | #90 | Exceptional 42.0% |
| Immigrants | Northern Africa | 98.9 /100 | #91 | Exceptional 41.9% |
| Maltese | 98.8 /100 | #92 | Exceptional 41.9% |
| Immigrants | Canada | 98.6 /100 | #93 | Exceptional 41.7% |
Demographics Similar to Ukrainians by Bachelor's Degree
In terms of bachelor's degree, the demographic groups most similar to Ukrainians are Arab (40.9%, a difference of 0.020%), Albanian (40.9%, a difference of 0.090%), Northern European (41.0%, a difference of 0.14%), Immigrants from Chile (40.8%, a difference of 0.14%), and Ugandan (40.8%, a difference of 0.19%).
| Demographics | Rating | Rank | Bachelor's Degree |
| Immigrants | Morocco | 98.0 /100 | #101 | Exceptional 41.4% |
| Immigrants | Italy | 97.8 /100 | #102 | Exceptional 41.3% |
| Chileans | 97.5 /100 | #103 | Exceptional 41.2% |
| Jordanians | 97.4 /100 | #104 | Exceptional 41.2% |
| Syrians | 97.4 /100 | #105 | Exceptional 41.1% |
| Alsatians | 97.0 /100 | #106 | Exceptional 41.0% |
| Northern Europeans | 96.8 /100 | #107 | Exceptional 41.0% |
| Ukrainians | 96.6 /100 | #108 | Exceptional 40.9% |
| Arabs | 96.6 /100 | #109 | Exceptional 40.9% |
| Albanians | 96.5 /100 | #110 | Exceptional 40.9% |
| Immigrants | Chile | 96.4 /100 | #111 | Exceptional 40.8% |
| Ugandans | 96.3 /100 | #112 | Exceptional 40.8% |
| Brazilians | 96.3 /100 | #113 | Exceptional 40.8% |
| Afghans | 96.2 /100 | #114 | Exceptional 40.8% |
| Palestinians | 95.8 /100 | #115 | Exceptional 40.7% |