Immigrants from Belarus vs Immigrants from England Professional Degree
COMPARE
Immigrants from Belarus
Immigrants from England
Professional Degree
Professional Degree Comparison
Immigrants from Belarus
Immigrants from England
5.5%
PROFESSIONAL DEGREE
99.9/ 100
METRIC RATING
62nd/ 347
METRIC RANK
5.3%
PROFESSIONAL DEGREE
99.6/ 100
METRIC RATING
80th/ 347
METRIC RANK
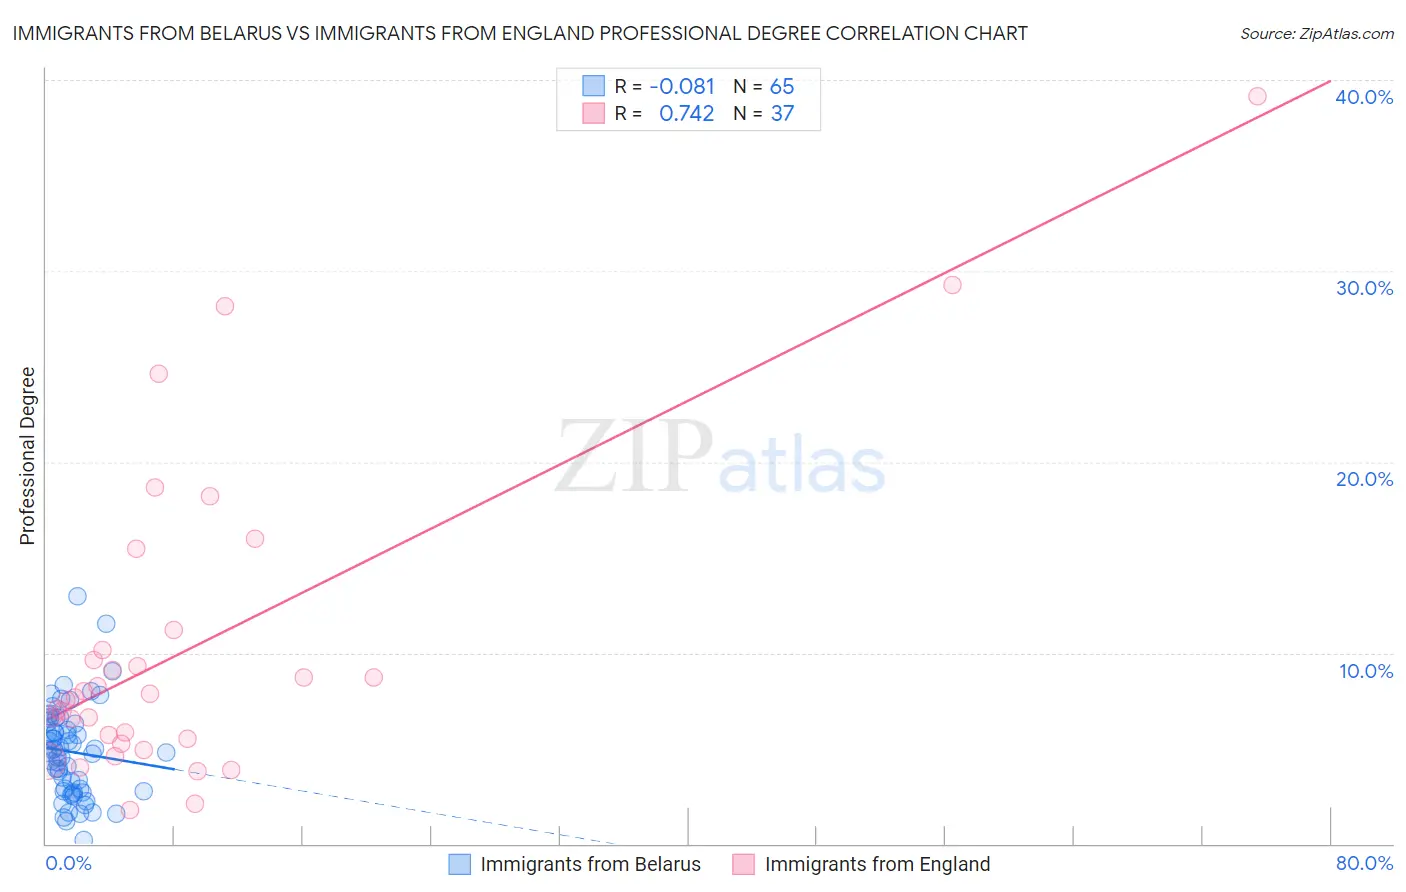
Immigrants from Belarus vs Immigrants from England Professional Degree Correlation Chart
The statistical analysis conducted on geographies consisting of 150,142,268 people shows a slight negative correlation between the proportion of Immigrants from Belarus and percentage of population with at least professional degree education in the United States with a correlation coefficient (R) of -0.081 and weighted average of 5.5%. Similarly, the statistical analysis conducted on geographies consisting of 391,206,555 people shows a strong positive correlation between the proportion of Immigrants from England and percentage of population with at least professional degree education in the United States with a correlation coefficient (R) of 0.742 and weighted average of 5.3%, a difference of 4.2%.
Professional Degree Correlation Summary
| Measurement | Immigrants from Belarus | Immigrants from England |
| Minimum | 0.19% | 1.8% |
| Maximum | 13.0% | 39.2% |
| Range | 12.8% | 37.4% |
| Mean | 4.8% | 10.3% |
| Median | 4.8% | 7.7% |
| Interquartile 25% (IQ1) | 2.8% | 5.4% |
| Interquartile 75% (IQ3) | 6.3% | 10.7% |
| Interquartile Range (IQR) | 3.6% | 5.3% |
| Standard Deviation (Sample) | 2.4% | 8.3% |
| Standard Deviation (Population) | 2.4% | 8.2% |
Demographics Similar to Immigrants from Belarus and Immigrants from England by Professional Degree
In terms of professional degree, the demographic groups most similar to Immigrants from Belarus are Asian (5.5%, a difference of 0.43%), Immigrants from Asia (5.5%, a difference of 0.49%), Immigrants from Bolivia (5.5%, a difference of 0.56%), Immigrants from Lithuania (5.6%, a difference of 0.76%), and Immigrants from Kazakhstan (5.5%, a difference of 0.79%). Similarly, the demographic groups most similar to Immigrants from England are Immigrants from Brazil (5.3%, a difference of 0.010%), Immigrants from North America (5.3%, a difference of 0.39%), Armenian (5.3%, a difference of 0.56%), Immigrants from Ethiopia (5.3%, a difference of 0.60%), and Immigrants from Canada (5.3%, a difference of 0.64%).
| Demographics | Rating | Rank | Professional Degree |
| Immigrants | Lithuania | 99.9 /100 | #61 | Exceptional 5.6% |
| Immigrants | Belarus | 99.9 /100 | #62 | Exceptional 5.5% |
| Asians | 99.9 /100 | #63 | Exceptional 5.5% |
| Immigrants | Asia | 99.9 /100 | #64 | Exceptional 5.5% |
| Immigrants | Bolivia | 99.9 /100 | #65 | Exceptional 5.5% |
| Immigrants | Kazakhstan | 99.9 /100 | #66 | Exceptional 5.5% |
| Immigrants | Bulgaria | 99.9 /100 | #67 | Exceptional 5.5% |
| Immigrants | Lebanon | 99.9 /100 | #68 | Exceptional 5.5% |
| Immigrants | Hungary | 99.9 /100 | #69 | Exceptional 5.5% |
| Bhutanese | 99.8 /100 | #70 | Exceptional 5.4% |
| Immigrants | Western Asia | 99.8 /100 | #71 | Exceptional 5.4% |
| Lithuanians | 99.8 /100 | #72 | Exceptional 5.4% |
| Immigrants | Romania | 99.8 /100 | #73 | Exceptional 5.4% |
| Ethiopians | 99.7 /100 | #74 | Exceptional 5.4% |
| Immigrants | Indonesia | 99.7 /100 | #75 | Exceptional 5.3% |
| Immigrants | Canada | 99.7 /100 | #76 | Exceptional 5.3% |
| Immigrants | Ethiopia | 99.7 /100 | #77 | Exceptional 5.3% |
| Armenians | 99.7 /100 | #78 | Exceptional 5.3% |
| Immigrants | North America | 99.7 /100 | #79 | Exceptional 5.3% |
| Immigrants | England | 99.6 /100 | #80 | Exceptional 5.3% |
| Immigrants | Brazil | 99.6 /100 | #81 | Exceptional 5.3% |