Immigrants from Belarus vs British Professional Degree
COMPARE
Immigrants from Belarus
British
Professional Degree
Professional Degree Comparison
Immigrants from Belarus
British
5.5%
PROFESSIONAL DEGREE
99.9/ 100
METRIC RATING
62nd/ 347
METRIC RANK
5.0%
PROFESSIONAL DEGREE
98.0/ 100
METRIC RATING
109th/ 347
METRIC RANK
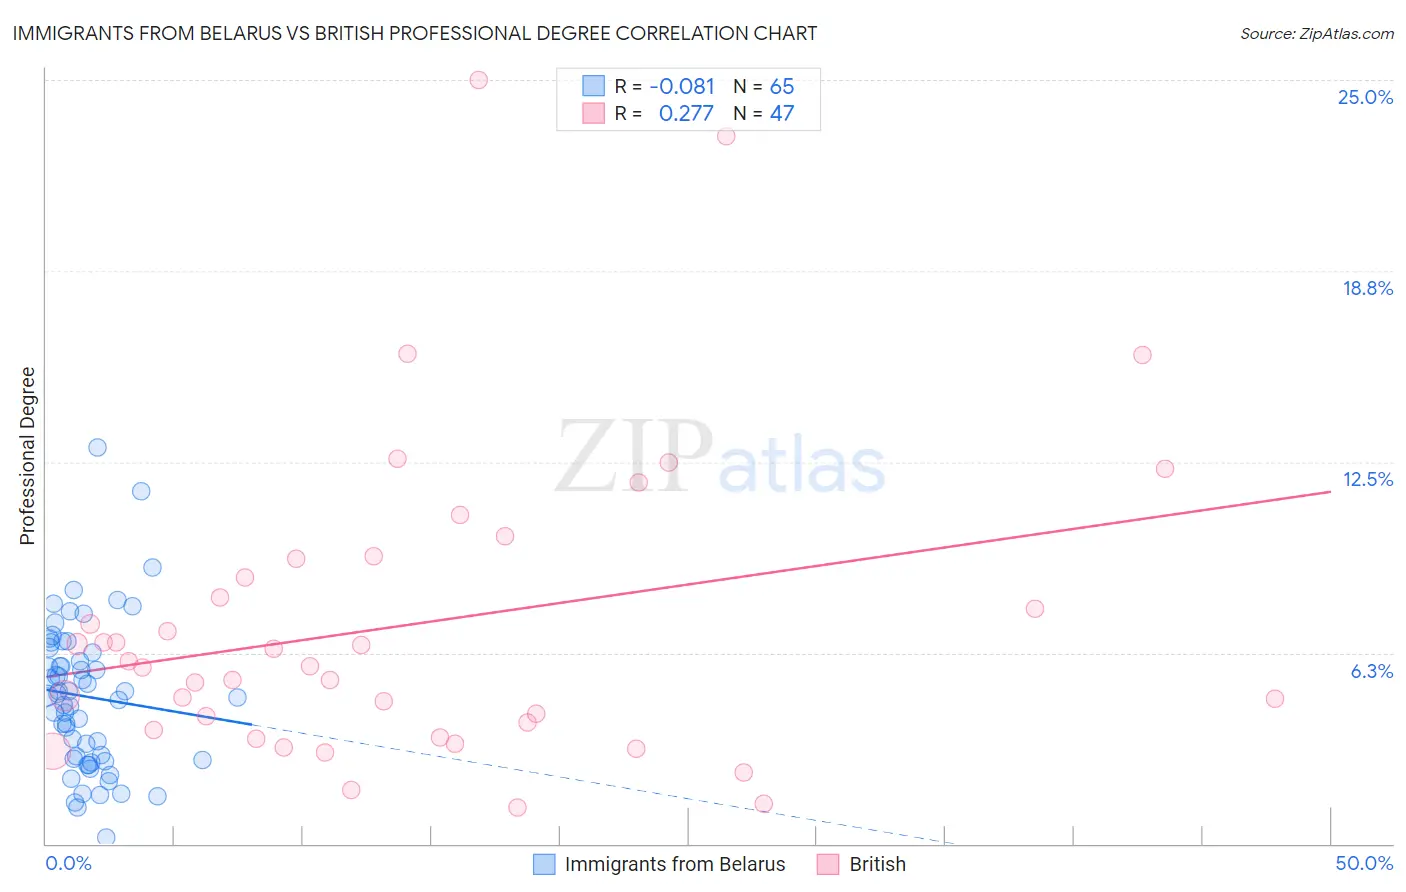
Immigrants from Belarus vs British Professional Degree Correlation Chart
The statistical analysis conducted on geographies consisting of 150,142,268 people shows a slight negative correlation between the proportion of Immigrants from Belarus and percentage of population with at least professional degree education in the United States with a correlation coefficient (R) of -0.081 and weighted average of 5.5%. Similarly, the statistical analysis conducted on geographies consisting of 527,483,146 people shows a weak positive correlation between the proportion of British and percentage of population with at least professional degree education in the United States with a correlation coefficient (R) of 0.277 and weighted average of 5.0%, a difference of 9.9%.
Professional Degree Correlation Summary
| Measurement | Immigrants from Belarus | British |
| Minimum | 0.19% | 1.2% |
| Maximum | 13.0% | 25.0% |
| Range | 12.8% | 23.8% |
| Mean | 4.8% | 7.2% |
| Median | 4.8% | 5.8% |
| Interquartile 25% (IQ1) | 2.8% | 3.7% |
| Interquartile 75% (IQ3) | 6.3% | 9.3% |
| Interquartile Range (IQR) | 3.6% | 5.6% |
| Standard Deviation (Sample) | 2.4% | 5.1% |
| Standard Deviation (Population) | 2.4% | 5.0% |
Similar Demographics by Professional Degree
Demographics Similar to Immigrants from Belarus by Professional Degree
In terms of professional degree, the demographic groups most similar to Immigrants from Belarus are Asian (5.5%, a difference of 0.43%), Immigrants from Asia (5.5%, a difference of 0.49%), Immigrants from Bolivia (5.5%, a difference of 0.56%), Immigrants from Lithuania (5.6%, a difference of 0.76%), and Immigrants from Kazakhstan (5.5%, a difference of 0.79%).
| Demographics | Rating | Rank | Professional Degree |
| Immigrants | Western Europe | 100.0 /100 | #55 | Exceptional 5.7% |
| Immigrants | Malaysia | 100.0 /100 | #56 | Exceptional 5.7% |
| South Africans | 100.0 /100 | #57 | Exceptional 5.7% |
| Bulgarians | 100.0 /100 | #58 | Exceptional 5.7% |
| Immigrants | Europe | 100.0 /100 | #59 | Exceptional 5.6% |
| Bolivians | 99.9 /100 | #60 | Exceptional 5.6% |
| Immigrants | Lithuania | 99.9 /100 | #61 | Exceptional 5.6% |
| Immigrants | Belarus | 99.9 /100 | #62 | Exceptional 5.5% |
| Asians | 99.9 /100 | #63 | Exceptional 5.5% |
| Immigrants | Asia | 99.9 /100 | #64 | Exceptional 5.5% |
| Immigrants | Bolivia | 99.9 /100 | #65 | Exceptional 5.5% |
| Immigrants | Kazakhstan | 99.9 /100 | #66 | Exceptional 5.5% |
| Immigrants | Bulgaria | 99.9 /100 | #67 | Exceptional 5.5% |
| Immigrants | Lebanon | 99.9 /100 | #68 | Exceptional 5.5% |
| Immigrants | Hungary | 99.9 /100 | #69 | Exceptional 5.5% |
Demographics Similar to British by Professional Degree
In terms of professional degree, the demographic groups most similar to British are Immigrants from Southern Europe (5.0%, a difference of 0.020%), Maltese (5.0%, a difference of 0.060%), Lebanese (5.0%, a difference of 0.15%), Immigrants from Ukraine (5.0%, a difference of 0.18%), and Immigrants from Uganda (5.0%, a difference of 0.21%).
| Demographics | Rating | Rank | Professional Degree |
| Ukrainians | 98.5 /100 | #102 | Exceptional 5.1% |
| Immigrants | Northern Africa | 98.4 /100 | #103 | Exceptional 5.1% |
| Arabs | 98.2 /100 | #104 | Exceptional 5.0% |
| Immigrants | Uganda | 98.2 /100 | #105 | Exceptional 5.0% |
| Immigrants | Ukraine | 98.2 /100 | #106 | Exceptional 5.0% |
| Maltese | 98.1 /100 | #107 | Exceptional 5.0% |
| Immigrants | Southern Europe | 98.1 /100 | #108 | Exceptional 5.0% |
| British | 98.0 /100 | #109 | Exceptional 5.0% |
| Lebanese | 98.0 /100 | #110 | Exceptional 5.0% |
| Brazilians | 97.4 /100 | #111 | Exceptional 5.0% |
| Taiwanese | 97.3 /100 | #112 | Exceptional 5.0% |
| Immigrants | Pakistan | 97.2 /100 | #113 | Exceptional 5.0% |
| Immigrants | Morocco | 96.8 /100 | #114 | Exceptional 5.0% |
| Moroccans | 96.8 /100 | #115 | Exceptional 5.0% |
| Venezuelans | 96.3 /100 | #116 | Exceptional 4.9% |