Immigrants from Barbados vs African Associate's Degree
COMPARE
Immigrants from Barbados
African
Associate's Degree
Associate's Degree Comparison
Immigrants from Barbados
Africans
43.3%
ASSOCIATE'S DEGREE
2.9/ 100
METRIC RATING
230th/ 347
METRIC RANK
41.1%
ASSOCIATE'S DEGREE
0.2/ 100
METRIC RATING
265th/ 347
METRIC RANK
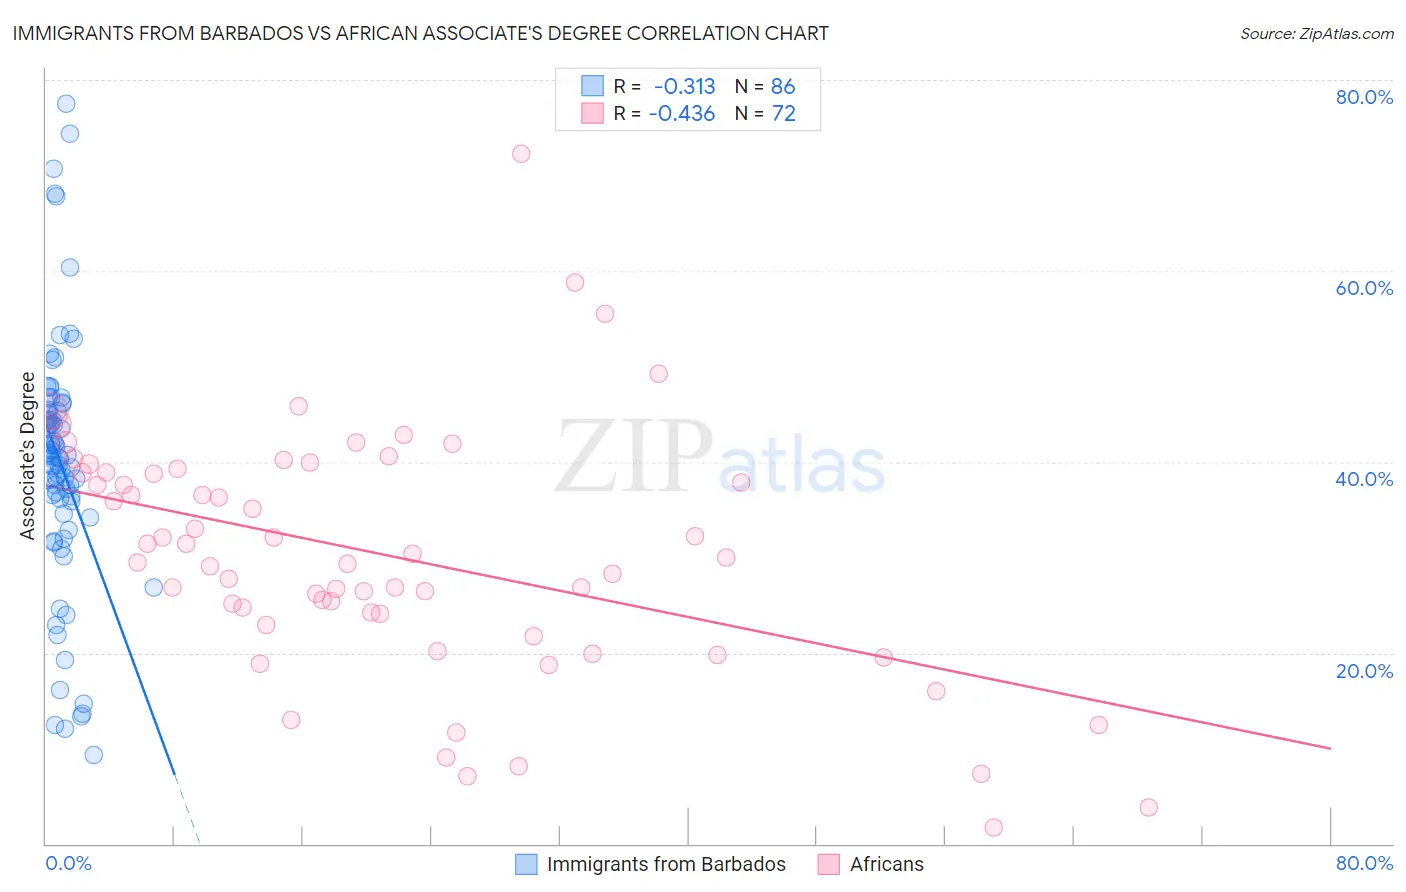
Immigrants from Barbados vs African Associate's Degree Correlation Chart
The statistical analysis conducted on geographies consisting of 112,783,541 people shows a mild negative correlation between the proportion of Immigrants from Barbados and percentage of population with at least associate's degree education in the United States with a correlation coefficient (R) of -0.313 and weighted average of 43.3%. Similarly, the statistical analysis conducted on geographies consisting of 470,057,267 people shows a moderate negative correlation between the proportion of Africans and percentage of population with at least associate's degree education in the United States with a correlation coefficient (R) of -0.436 and weighted average of 41.1%, a difference of 5.3%.
Associate's Degree Correlation Summary
| Measurement | Immigrants from Barbados | African |
| Minimum | 9.3% | 1.7% |
| Maximum | 77.4% | 72.2% |
| Range | 68.2% | 70.5% |
| Mean | 40.0% | 30.2% |
| Median | 40.7% | 29.7% |
| Interquartile 25% (IQ1) | 35.9% | 23.5% |
| Interquartile 75% (IQ3) | 45.3% | 38.9% |
| Interquartile Range (IQR) | 9.5% | 15.4% |
| Standard Deviation (Sample) | 13.1% | 12.9% |
| Standard Deviation (Population) | 13.0% | 12.8% |
Similar Demographics by Associate's Degree
Demographics Similar to Immigrants from Barbados by Associate's Degree
In terms of associate's degree, the demographic groups most similar to Immigrants from Barbados are Liberian (43.3%, a difference of 0.010%), Immigrants from Trinidad and Tobago (43.3%, a difference of 0.070%), Hmong (43.4%, a difference of 0.23%), Native Hawaiian (43.1%, a difference of 0.43%), and Tongan (43.0%, a difference of 0.60%).
| Demographics | Rating | Rank | Associate's Degree |
| Sub-Saharan Africans | 5.5 /100 | #223 | Tragic 43.9% |
| West Indians | 5.2 /100 | #224 | Tragic 43.8% |
| Guamanians/Chamorros | 4.8 /100 | #225 | Tragic 43.8% |
| Immigrants | Burma/Myanmar | 4.3 /100 | #226 | Tragic 43.7% |
| Trinidadians and Tobagonians | 4.0 /100 | #227 | Tragic 43.6% |
| Hmong | 3.2 /100 | #228 | Tragic 43.4% |
| Immigrants | Trinidad and Tobago | 3.0 /100 | #229 | Tragic 43.3% |
| Immigrants | Barbados | 2.9 /100 | #230 | Tragic 43.3% |
| Liberians | 2.9 /100 | #231 | Tragic 43.3% |
| Native Hawaiians | 2.3 /100 | #232 | Tragic 43.1% |
| Tongans | 2.2 /100 | #233 | Tragic 43.0% |
| Tlingit-Haida | 2.1 /100 | #234 | Tragic 43.0% |
| Ecuadorians | 2.0 /100 | #235 | Tragic 43.0% |
| Immigrants | St. Vincent and the Grenadines | 1.9 /100 | #236 | Tragic 42.9% |
| Immigrants | Nonimmigrants | 1.9 /100 | #237 | Tragic 42.9% |
Demographics Similar to Africans by Associate's Degree
In terms of associate's degree, the demographic groups most similar to Africans are Samoan (41.1%, a difference of 0.0%), Hawaiian (40.9%, a difference of 0.56%), Osage (41.5%, a difference of 0.76%), Central American Indian (40.8%, a difference of 0.76%), and Immigrants from Jamaica (41.5%, a difference of 0.77%).
| Demographics | Rating | Rank | Associate's Degree |
| Japanese | 0.5 /100 | #258 | Tragic 41.7% |
| Malaysians | 0.4 /100 | #259 | Tragic 41.6% |
| Marshallese | 0.4 /100 | #260 | Tragic 41.6% |
| Nicaraguans | 0.4 /100 | #261 | Tragic 41.5% |
| Bahamians | 0.4 /100 | #262 | Tragic 41.5% |
| Immigrants | Jamaica | 0.3 /100 | #263 | Tragic 41.5% |
| Osage | 0.3 /100 | #264 | Tragic 41.5% |
| Africans | 0.2 /100 | #265 | Tragic 41.1% |
| Samoans | 0.2 /100 | #266 | Tragic 41.1% |
| Hawaiians | 0.2 /100 | #267 | Tragic 40.9% |
| Central American Indians | 0.2 /100 | #268 | Tragic 40.8% |
| Americans | 0.2 /100 | #269 | Tragic 40.8% |
| Chippewa | 0.2 /100 | #270 | Tragic 40.7% |
| Immigrants | Laos | 0.1 /100 | #271 | Tragic 40.7% |
| Belizeans | 0.1 /100 | #272 | Tragic 40.6% |