Celtic vs Tohono O'odham Professional Degree
COMPARE
Celtic
Tohono O'odham
Professional Degree
Professional Degree Comparison
Celtics
Tohono O'odham
4.4%
PROFESSIONAL DEGREE
47.6/ 100
METRIC RATING
177th/ 347
METRIC RANK
2.8%
PROFESSIONAL DEGREE
0.0/ 100
METRIC RATING
341st/ 347
METRIC RANK
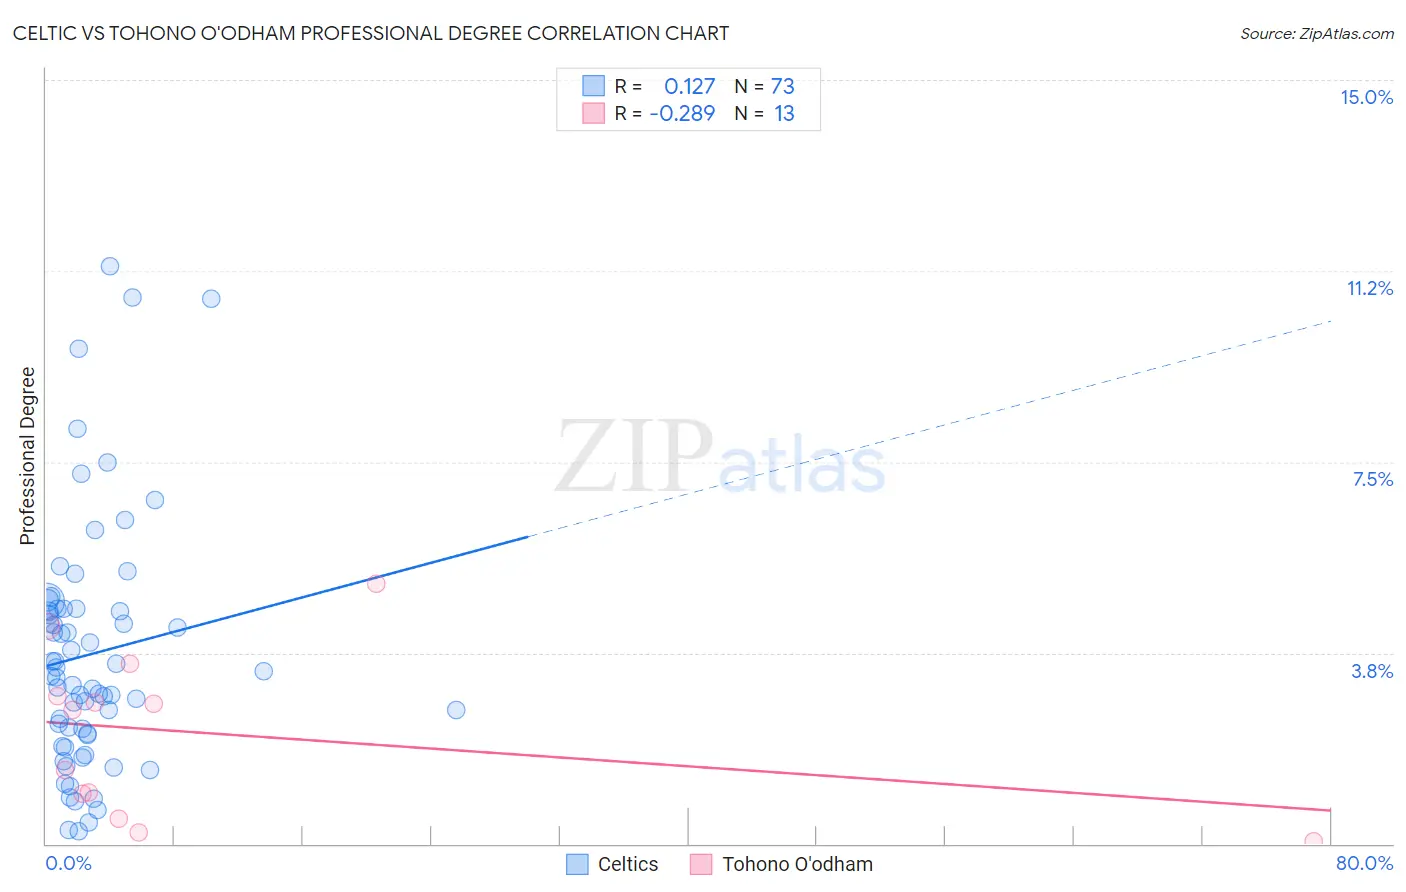
Celtic vs Tohono O'odham Professional Degree Correlation Chart
The statistical analysis conducted on geographies consisting of 168,640,863 people shows a poor positive correlation between the proportion of Celtics and percentage of population with at least professional degree education in the United States with a correlation coefficient (R) of 0.127 and weighted average of 4.4%. Similarly, the statistical analysis conducted on geographies consisting of 58,607,680 people shows a weak negative correlation between the proportion of Tohono O'odham and percentage of population with at least professional degree education in the United States with a correlation coefficient (R) of -0.289 and weighted average of 2.8%, a difference of 54.3%.
Professional Degree Correlation Summary
| Measurement | Celtic | Tohono O'odham |
| Minimum | 0.25% | 0.045% |
| Maximum | 11.4% | 5.1% |
| Range | 11.1% | 5.1% |
| Mean | 3.7% | 2.2% |
| Median | 3.3% | 2.6% |
| Interquartile 25% (IQ1) | 2.2% | 0.74% |
| Interquartile 75% (IQ3) | 4.6% | 3.2% |
| Interquartile Range (IQR) | 2.5% | 2.5% |
| Standard Deviation (Sample) | 2.4% | 1.6% |
| Standard Deviation (Population) | 2.4% | 1.5% |
Similar Demographics by Professional Degree
Demographics Similar to Celtics by Professional Degree
In terms of professional degree, the demographic groups most similar to Celtics are Immigrants from Costa Rica (4.4%, a difference of 0.13%), Immigrants from Kenya (4.4%, a difference of 0.24%), Immigrants from Peru (4.4%, a difference of 0.25%), Kenyan (4.4%, a difference of 0.35%), and Irish (4.4%, a difference of 0.35%).
| Demographics | Rating | Rank | Professional Degree |
| Immigrants | Zaire | 57.4 /100 | #170 | Average 4.5% |
| Immigrants | Bangladesh | 56.0 /100 | #171 | Average 4.4% |
| Spaniards | 52.0 /100 | #172 | Average 4.4% |
| English | 50.1 /100 | #173 | Average 4.4% |
| Kenyans | 50.0 /100 | #174 | Average 4.4% |
| Irish | 50.0 /100 | #175 | Average 4.4% |
| Immigrants | Peru | 49.3 /100 | #176 | Average 4.4% |
| Celtics | 47.6 /100 | #177 | Average 4.4% |
| Immigrants | Costa Rica | 46.7 /100 | #178 | Average 4.4% |
| Immigrants | Kenya | 45.9 /100 | #179 | Average 4.4% |
| Czechs | 44.9 /100 | #180 | Average 4.4% |
| Danes | 43.5 /100 | #181 | Average 4.4% |
| Immigrants | Immigrants | 43.2 /100 | #182 | Average 4.4% |
| Bermudans | 43.1 /100 | #183 | Average 4.4% |
| Belgians | 36.2 /100 | #184 | Fair 4.3% |
Demographics Similar to Tohono O'odham by Professional Degree
In terms of professional degree, the demographic groups most similar to Tohono O'odham are Immigrants from the Azores (2.8%, a difference of 0.66%), Yup'ik (2.9%, a difference of 0.78%), Immigrants from Central America (2.9%, a difference of 0.83%), Navajo (2.9%, a difference of 0.95%), and Arapaho (2.9%, a difference of 1.0%).
| Demographics | Rating | Rank | Professional Degree |
| Puget Sound Salish | 0.0 /100 | #333 | Tragic 3.1% |
| Pennsylvania Germans | 0.0 /100 | #334 | Tragic 3.0% |
| Natives/Alaskans | 0.0 /100 | #335 | Tragic 3.0% |
| Fijians | 0.0 /100 | #336 | Tragic 2.9% |
| Arapaho | 0.0 /100 | #337 | Tragic 2.9% |
| Navajo | 0.0 /100 | #338 | Tragic 2.9% |
| Immigrants | Central America | 0.0 /100 | #339 | Tragic 2.9% |
| Yup'ik | 0.0 /100 | #340 | Tragic 2.9% |
| Tohono O'odham | 0.0 /100 | #341 | Tragic 2.8% |
| Immigrants | Azores | 0.0 /100 | #342 | Tragic 2.8% |
| Mexicans | 0.0 /100 | #343 | Tragic 2.7% |
| Spanish American Indians | 0.0 /100 | #344 | Tragic 2.7% |
| Immigrants | Mexico | 0.0 /100 | #345 | Tragic 2.6% |
| Lumbee | 0.0 /100 | #346 | Tragic 2.5% |
| Houma | 0.0 /100 | #347 | Tragic 2.2% |