Immigrants from Bahamas vs Immigrants from Eastern Asia Professional Degree
COMPARE
Immigrants from Bahamas
Immigrants from Eastern Asia
Professional Degree
Professional Degree Comparison
Immigrants from Bahamas
Immigrants from Eastern Asia
3.8%
PROFESSIONAL DEGREE
2.0/ 100
METRIC RATING
244th/ 347
METRIC RANK
6.6%
PROFESSIONAL DEGREE
100.0/ 100
METRIC RATING
17th/ 347
METRIC RANK
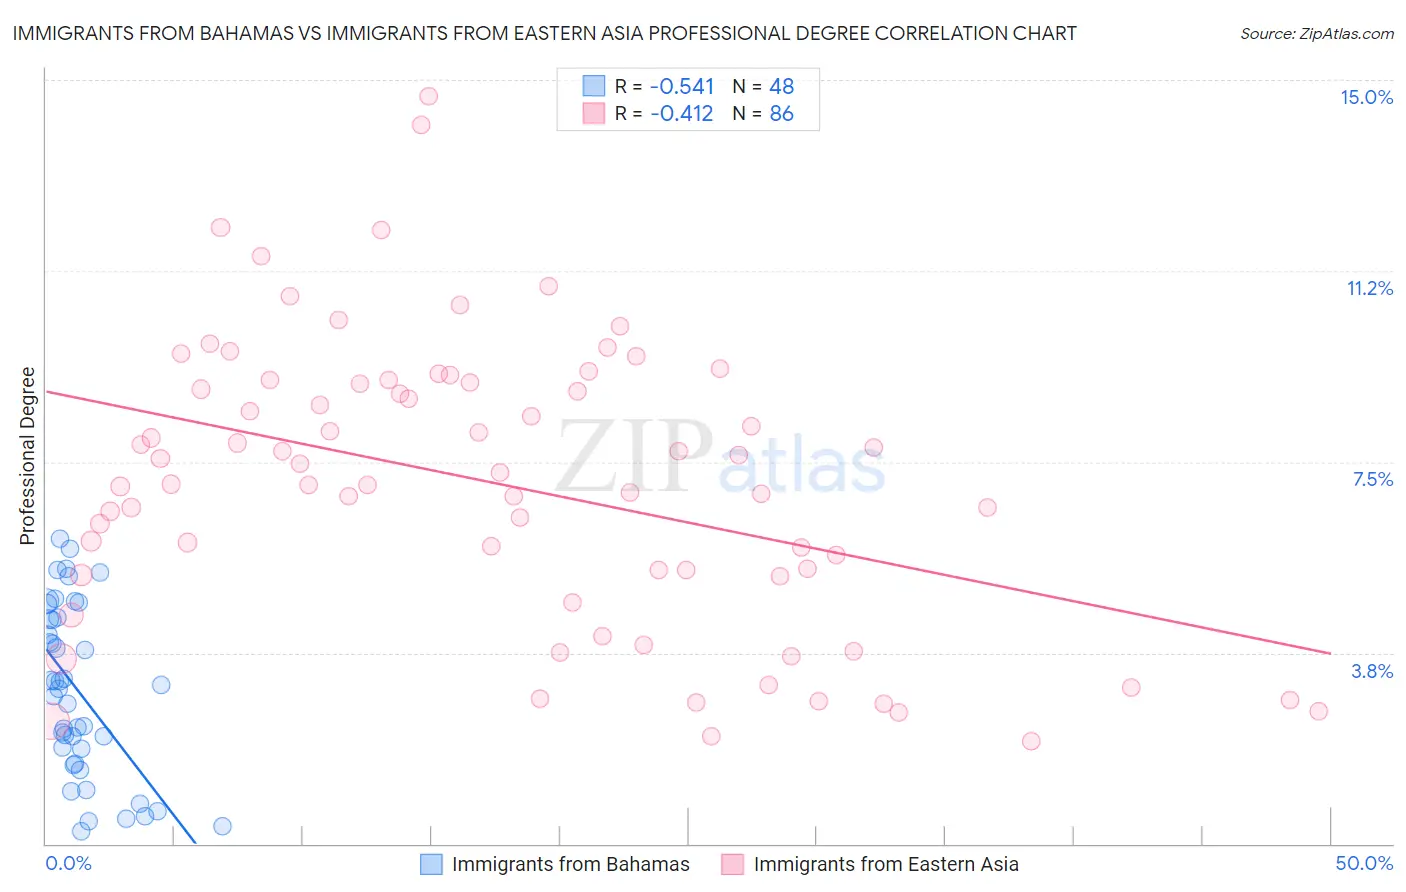
Immigrants from Bahamas vs Immigrants from Eastern Asia Professional Degree Correlation Chart
The statistical analysis conducted on geographies consisting of 104,591,869 people shows a substantial negative correlation between the proportion of Immigrants from Bahamas and percentage of population with at least professional degree education in the United States with a correlation coefficient (R) of -0.541 and weighted average of 3.8%. Similarly, the statistical analysis conducted on geographies consisting of 498,075,590 people shows a moderate negative correlation between the proportion of Immigrants from Eastern Asia and percentage of population with at least professional degree education in the United States with a correlation coefficient (R) of -0.412 and weighted average of 6.6%, a difference of 73.5%.
Professional Degree Correlation Summary
| Measurement | Immigrants from Bahamas | Immigrants from Eastern Asia |
| Minimum | 0.24% | 2.0% |
| Maximum | 6.0% | 14.7% |
| Range | 5.7% | 12.7% |
| Mean | 3.0% | 7.1% |
| Median | 3.1% | 7.2% |
| Interquartile 25% (IQ1) | 1.7% | 5.3% |
| Interquartile 75% (IQ3) | 4.4% | 9.1% |
| Interquartile Range (IQR) | 2.7% | 3.8% |
| Standard Deviation (Sample) | 1.7% | 2.8% |
| Standard Deviation (Population) | 1.6% | 2.8% |
Similar Demographics by Professional Degree
Demographics Similar to Immigrants from Bahamas by Professional Degree
In terms of professional degree, the demographic groups most similar to Immigrants from Bahamas are Guamanian/Chamorro (3.8%, a difference of 0.43%), Alaskan Athabascan (3.8%, a difference of 0.51%), Native Hawaiian (3.8%, a difference of 0.51%), Immigrants from Ecuador (3.8%, a difference of 0.53%), and French American Indian (3.8%, a difference of 0.70%).
| Demographics | Rating | Rank | Professional Degree |
| Immigrants | Trinidad and Tobago | 3.8 /100 | #237 | Tragic 3.9% |
| Colville | 2.6 /100 | #238 | Tragic 3.8% |
| British West Indians | 2.4 /100 | #239 | Tragic 3.8% |
| Immigrants | Ecuador | 2.3 /100 | #240 | Tragic 3.8% |
| Alaskan Athabascans | 2.3 /100 | #241 | Tragic 3.8% |
| Native Hawaiians | 2.3 /100 | #242 | Tragic 3.8% |
| Guamanians/Chamorros | 2.2 /100 | #243 | Tragic 3.8% |
| Immigrants | Bahamas | 2.0 /100 | #244 | Tragic 3.8% |
| French American Indians | 1.7 /100 | #245 | Tragic 3.8% |
| Marshallese | 1.7 /100 | #246 | Tragic 3.8% |
| Guyanese | 1.6 /100 | #247 | Tragic 3.8% |
| Hmong | 1.6 /100 | #248 | Tragic 3.7% |
| Immigrants | Grenada | 1.5 /100 | #249 | Tragic 3.7% |
| Immigrants | Fiji | 1.5 /100 | #250 | Tragic 3.7% |
| Immigrants | Nicaragua | 1.4 /100 | #251 | Tragic 3.7% |
Demographics Similar to Immigrants from Eastern Asia by Professional Degree
In terms of professional degree, the demographic groups most similar to Immigrants from Eastern Asia are Soviet Union (6.6%, a difference of 0.020%), Indian (Asian) (6.5%, a difference of 0.68%), Immigrants from Sweden (6.7%, a difference of 2.0%), Immigrants from Denmark (6.4%, a difference of 2.2%), and Immigrants from Hong Kong (6.4%, a difference of 2.5%).
| Demographics | Rating | Rank | Professional Degree |
| Immigrants | Belgium | 100.0 /100 | #10 | Exceptional 7.0% |
| Cypriots | 100.0 /100 | #11 | Exceptional 6.9% |
| Israelis | 100.0 /100 | #12 | Exceptional 6.9% |
| Immigrants | Australia | 100.0 /100 | #13 | Exceptional 6.9% |
| Immigrants | France | 100.0 /100 | #14 | Exceptional 6.8% |
| Immigrants | China | 100.0 /100 | #15 | Exceptional 6.7% |
| Immigrants | Sweden | 100.0 /100 | #16 | Exceptional 6.7% |
| Immigrants | Eastern Asia | 100.0 /100 | #17 | Exceptional 6.6% |
| Soviet Union | 100.0 /100 | #18 | Exceptional 6.6% |
| Indians (Asian) | 100.0 /100 | #19 | Exceptional 6.5% |
| Immigrants | Denmark | 100.0 /100 | #20 | Exceptional 6.4% |
| Immigrants | Hong Kong | 100.0 /100 | #21 | Exceptional 6.4% |
| Immigrants | Japan | 100.0 /100 | #22 | Exceptional 6.4% |
| Russians | 100.0 /100 | #23 | Exceptional 6.3% |
| Immigrants | Spain | 100.0 /100 | #24 | Exceptional 6.3% |