Immigrants from Bahamas vs Immigrants from Zimbabwe Professional Degree
COMPARE
Immigrants from Bahamas
Immigrants from Zimbabwe
Professional Degree
Professional Degree Comparison
Immigrants from Bahamas
Immigrants from Zimbabwe
3.8%
PROFESSIONAL DEGREE
2.0/ 100
METRIC RATING
244th/ 347
METRIC RANK
5.3%
PROFESSIONAL DEGREE
99.6/ 100
METRIC RATING
85th/ 347
METRIC RANK
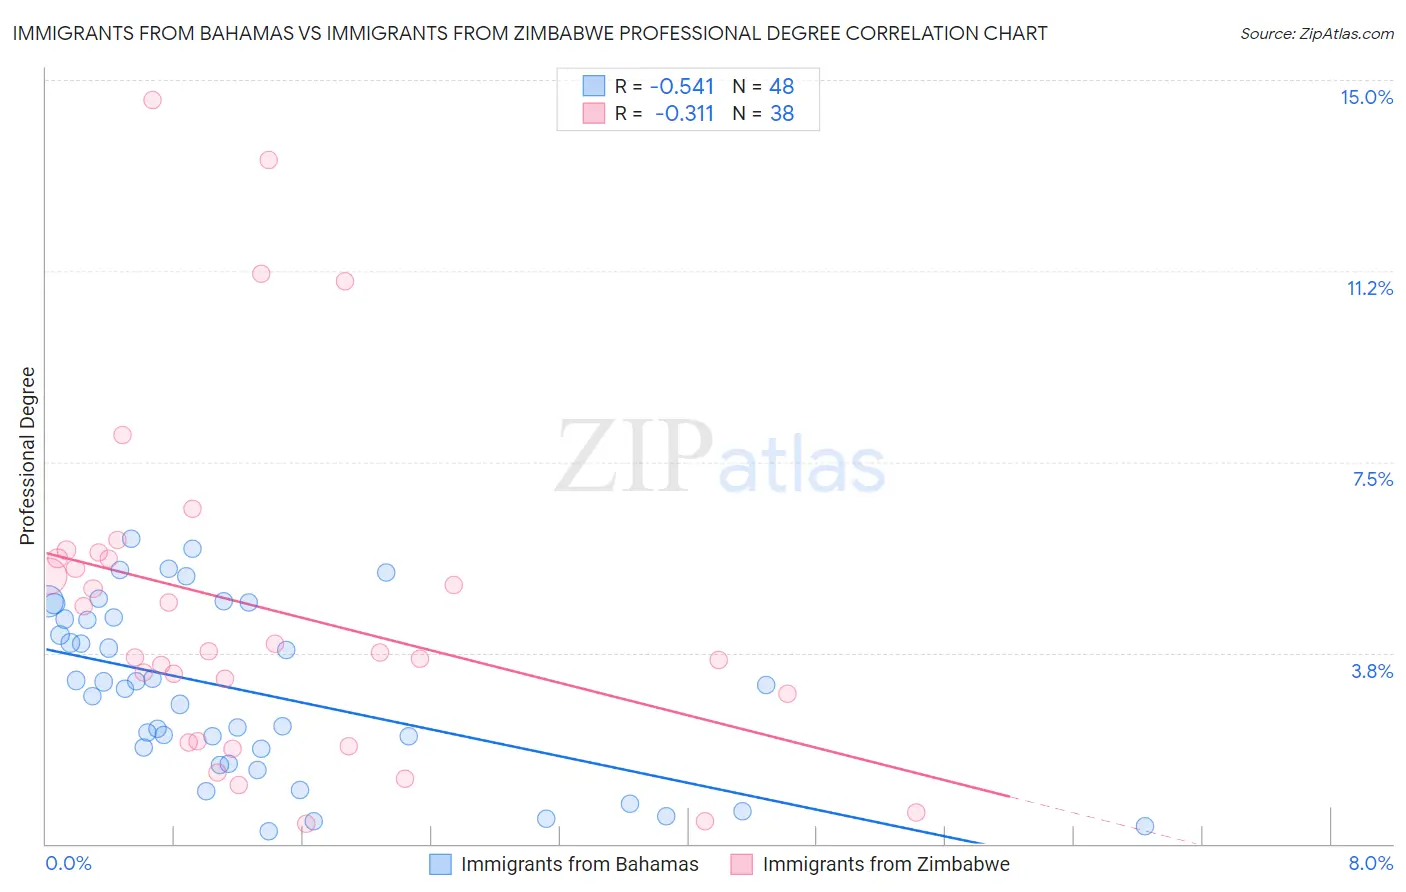
Immigrants from Bahamas vs Immigrants from Zimbabwe Professional Degree Correlation Chart
The statistical analysis conducted on geographies consisting of 104,591,869 people shows a substantial negative correlation between the proportion of Immigrants from Bahamas and percentage of population with at least professional degree education in the United States with a correlation coefficient (R) of -0.541 and weighted average of 3.8%. Similarly, the statistical analysis conducted on geographies consisting of 117,758,651 people shows a mild negative correlation between the proportion of Immigrants from Zimbabwe and percentage of population with at least professional degree education in the United States with a correlation coefficient (R) of -0.311 and weighted average of 5.3%, a difference of 39.3%.
Professional Degree Correlation Summary
| Measurement | Immigrants from Bahamas | Immigrants from Zimbabwe |
| Minimum | 0.24% | 0.39% |
| Maximum | 6.0% | 14.6% |
| Range | 5.7% | 14.2% |
| Mean | 3.0% | 4.6% |
| Median | 3.1% | 3.8% |
| Interquartile 25% (IQ1) | 1.7% | 2.0% |
| Interquartile 75% (IQ3) | 4.4% | 5.6% |
| Interquartile Range (IQR) | 2.7% | 3.6% |
| Standard Deviation (Sample) | 1.7% | 3.3% |
| Standard Deviation (Population) | 1.6% | 3.3% |
Similar Demographics by Professional Degree
Demographics Similar to Immigrants from Bahamas by Professional Degree
In terms of professional degree, the demographic groups most similar to Immigrants from Bahamas are Guamanian/Chamorro (3.8%, a difference of 0.43%), Alaskan Athabascan (3.8%, a difference of 0.51%), Native Hawaiian (3.8%, a difference of 0.51%), Immigrants from Ecuador (3.8%, a difference of 0.53%), and French American Indian (3.8%, a difference of 0.70%).
| Demographics | Rating | Rank | Professional Degree |
| Immigrants | Trinidad and Tobago | 3.8 /100 | #237 | Tragic 3.9% |
| Colville | 2.6 /100 | #238 | Tragic 3.8% |
| British West Indians | 2.4 /100 | #239 | Tragic 3.8% |
| Immigrants | Ecuador | 2.3 /100 | #240 | Tragic 3.8% |
| Alaskan Athabascans | 2.3 /100 | #241 | Tragic 3.8% |
| Native Hawaiians | 2.3 /100 | #242 | Tragic 3.8% |
| Guamanians/Chamorros | 2.2 /100 | #243 | Tragic 3.8% |
| Immigrants | Bahamas | 2.0 /100 | #244 | Tragic 3.8% |
| French American Indians | 1.7 /100 | #245 | Tragic 3.8% |
| Marshallese | 1.7 /100 | #246 | Tragic 3.8% |
| Guyanese | 1.6 /100 | #247 | Tragic 3.8% |
| Hmong | 1.6 /100 | #248 | Tragic 3.7% |
| Immigrants | Grenada | 1.5 /100 | #249 | Tragic 3.7% |
| Immigrants | Fiji | 1.5 /100 | #250 | Tragic 3.7% |
| Immigrants | Nicaragua | 1.4 /100 | #251 | Tragic 3.7% |
Demographics Similar to Immigrants from Zimbabwe by Professional Degree
In terms of professional degree, the demographic groups most similar to Immigrants from Zimbabwe are Greek (5.3%, a difference of 0.0%), Carpatho Rusyn (5.3%, a difference of 0.020%), Immigrants from Croatia (5.3%, a difference of 0.020%), Immigrants from Chile (5.3%, a difference of 0.11%), and Romanian (5.3%, a difference of 0.22%).
| Demographics | Rating | Rank | Professional Degree |
| Armenians | 99.7 /100 | #78 | Exceptional 5.3% |
| Immigrants | North America | 99.7 /100 | #79 | Exceptional 5.3% |
| Immigrants | England | 99.6 /100 | #80 | Exceptional 5.3% |
| Immigrants | Brazil | 99.6 /100 | #81 | Exceptional 5.3% |
| Romanians | 99.6 /100 | #82 | Exceptional 5.3% |
| Carpatho Rusyns | 99.6 /100 | #83 | Exceptional 5.3% |
| Immigrants | Croatia | 99.6 /100 | #84 | Exceptional 5.3% |
| Immigrants | Zimbabwe | 99.6 /100 | #85 | Exceptional 5.3% |
| Greeks | 99.6 /100 | #86 | Exceptional 5.3% |
| Immigrants | Chile | 99.5 /100 | #87 | Exceptional 5.3% |
| Egyptians | 99.5 /100 | #88 | Exceptional 5.3% |
| Chileans | 99.5 /100 | #89 | Exceptional 5.3% |
| Immigrants | Scotland | 99.5 /100 | #90 | Exceptional 5.3% |
| Laotians | 99.5 /100 | #91 | Exceptional 5.2% |
| Immigrants | Eastern Europe | 99.5 /100 | #92 | Exceptional 5.2% |