Immigrants from Ghana vs Tohono O'odham Professional Degree
COMPARE
Immigrants from Ghana
Tohono O'odham
Professional Degree
Professional Degree Comparison
Immigrants from Ghana
Tohono O'odham
4.1%
PROFESSIONAL DEGREE
10.6/ 100
METRIC RATING
214th/ 347
METRIC RANK
2.8%
PROFESSIONAL DEGREE
0.0/ 100
METRIC RATING
341st/ 347
METRIC RANK
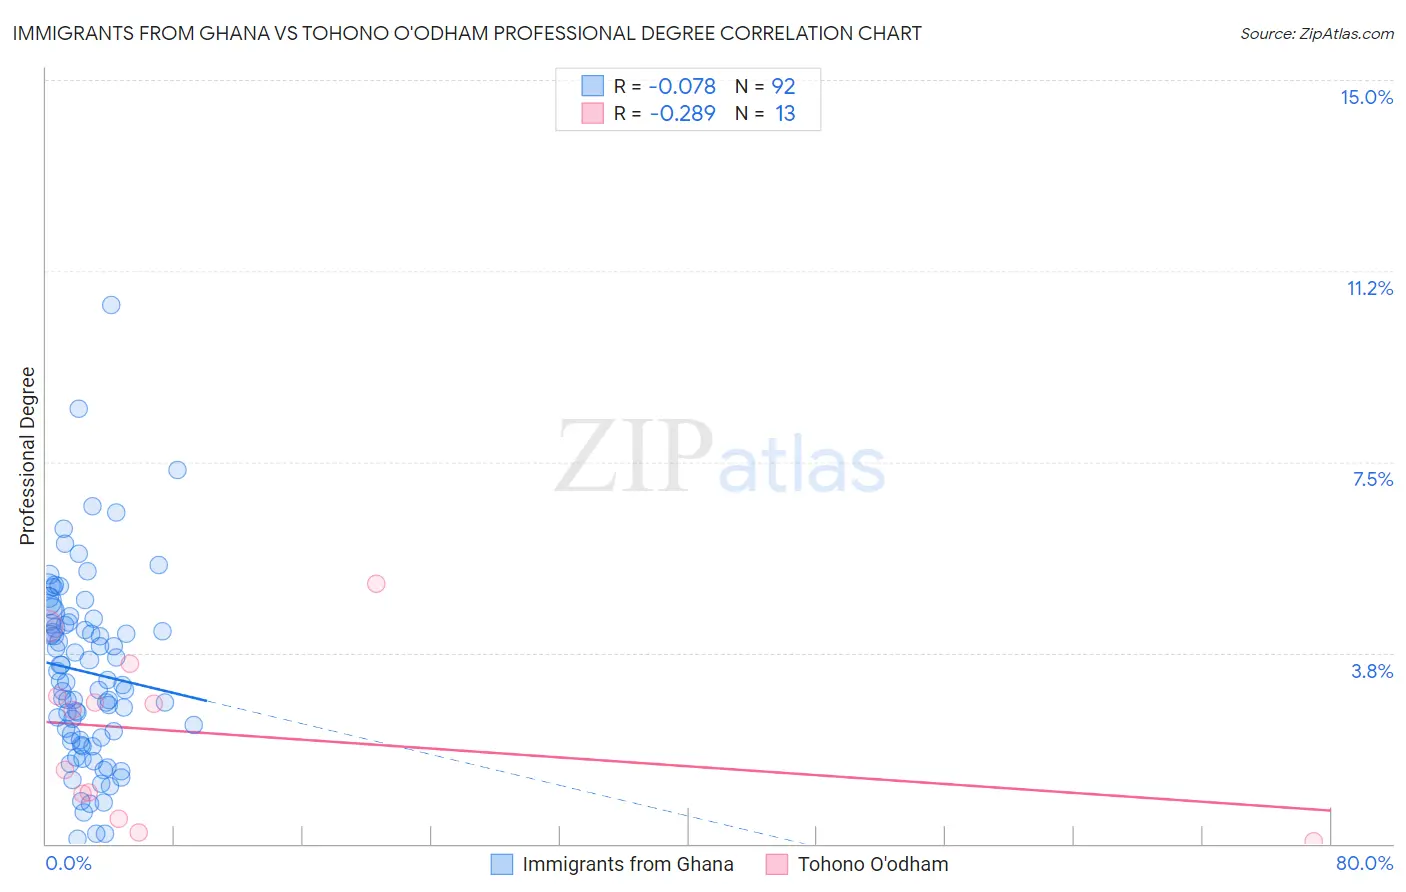
Immigrants from Ghana vs Tohono O'odham Professional Degree Correlation Chart
The statistical analysis conducted on geographies consisting of 199,711,542 people shows a slight negative correlation between the proportion of Immigrants from Ghana and percentage of population with at least professional degree education in the United States with a correlation coefficient (R) of -0.078 and weighted average of 4.1%. Similarly, the statistical analysis conducted on geographies consisting of 58,607,680 people shows a weak negative correlation between the proportion of Tohono O'odham and percentage of population with at least professional degree education in the United States with a correlation coefficient (R) of -0.289 and weighted average of 2.8%, a difference of 42.8%.
Professional Degree Correlation Summary
| Measurement | Immigrants from Ghana | Tohono O'odham |
| Minimum | 0.098% | 0.045% |
| Maximum | 10.6% | 5.1% |
| Range | 10.5% | 5.1% |
| Mean | 3.4% | 2.2% |
| Median | 3.2% | 2.6% |
| Interquartile 25% (IQ1) | 2.1% | 0.74% |
| Interquartile 75% (IQ3) | 4.3% | 3.2% |
| Interquartile Range (IQR) | 2.3% | 2.5% |
| Standard Deviation (Sample) | 1.8% | 1.6% |
| Standard Deviation (Population) | 1.8% | 1.5% |
Similar Demographics by Professional Degree
Demographics Similar to Immigrants from Ghana by Professional Degree
In terms of professional degree, the demographic groups most similar to Immigrants from Ghana are Korean (4.1%, a difference of 0.050%), Portuguese (4.1%, a difference of 0.050%), White/Caucasian (4.1%, a difference of 0.23%), West Indian (4.1%, a difference of 0.37%), and German (4.1%, a difference of 0.41%).
| Demographics | Rating | Rank | Professional Degree |
| Sub-Saharan Africans | 12.8 /100 | #207 | Poor 4.1% |
| Immigrants | Somalia | 12.5 /100 | #208 | Poor 4.1% |
| Immigrants | Panama | 12.3 /100 | #209 | Poor 4.1% |
| Immigrants | Nigeria | 11.7 /100 | #210 | Poor 4.1% |
| Germans | 11.6 /100 | #211 | Poor 4.1% |
| Whites/Caucasians | 11.2 /100 | #212 | Poor 4.1% |
| Koreans | 10.7 /100 | #213 | Poor 4.1% |
| Immigrants | Ghana | 10.6 /100 | #214 | Poor 4.1% |
| Portuguese | 10.5 /100 | #215 | Poor 4.1% |
| West Indians | 9.8 /100 | #216 | Tragic 4.1% |
| Immigrants | Vietnam | 9.4 /100 | #217 | Tragic 4.0% |
| Dutch | 9.0 /100 | #218 | Tragic 4.0% |
| Immigrants | South Eastern Asia | 8.9 /100 | #219 | Tragic 4.0% |
| Ute | 8.2 /100 | #220 | Tragic 4.0% |
| French Canadians | 8.0 /100 | #221 | Tragic 4.0% |
Demographics Similar to Tohono O'odham by Professional Degree
In terms of professional degree, the demographic groups most similar to Tohono O'odham are Immigrants from the Azores (2.8%, a difference of 0.66%), Yup'ik (2.9%, a difference of 0.78%), Immigrants from Central America (2.9%, a difference of 0.83%), Navajo (2.9%, a difference of 0.95%), and Arapaho (2.9%, a difference of 1.0%).
| Demographics | Rating | Rank | Professional Degree |
| Puget Sound Salish | 0.0 /100 | #333 | Tragic 3.1% |
| Pennsylvania Germans | 0.0 /100 | #334 | Tragic 3.0% |
| Natives/Alaskans | 0.0 /100 | #335 | Tragic 3.0% |
| Fijians | 0.0 /100 | #336 | Tragic 2.9% |
| Arapaho | 0.0 /100 | #337 | Tragic 2.9% |
| Navajo | 0.0 /100 | #338 | Tragic 2.9% |
| Immigrants | Central America | 0.0 /100 | #339 | Tragic 2.9% |
| Yup'ik | 0.0 /100 | #340 | Tragic 2.9% |
| Tohono O'odham | 0.0 /100 | #341 | Tragic 2.8% |
| Immigrants | Azores | 0.0 /100 | #342 | Tragic 2.8% |
| Mexicans | 0.0 /100 | #343 | Tragic 2.7% |
| Spanish American Indians | 0.0 /100 | #344 | Tragic 2.7% |
| Immigrants | Mexico | 0.0 /100 | #345 | Tragic 2.6% |
| Lumbee | 0.0 /100 | #346 | Tragic 2.5% |
| Houma | 0.0 /100 | #347 | Tragic 2.2% |