Immigrants from Saudi Arabia vs Tohono O'odham Professional Degree
COMPARE
Immigrants from Saudi Arabia
Tohono O'odham
Professional Degree
Professional Degree Comparison
Immigrants from Saudi Arabia
Tohono O'odham
5.9%
PROFESSIONAL DEGREE
100.0/ 100
METRIC RATING
43rd/ 347
METRIC RANK
2.8%
PROFESSIONAL DEGREE
0.0/ 100
METRIC RATING
341st/ 347
METRIC RANK
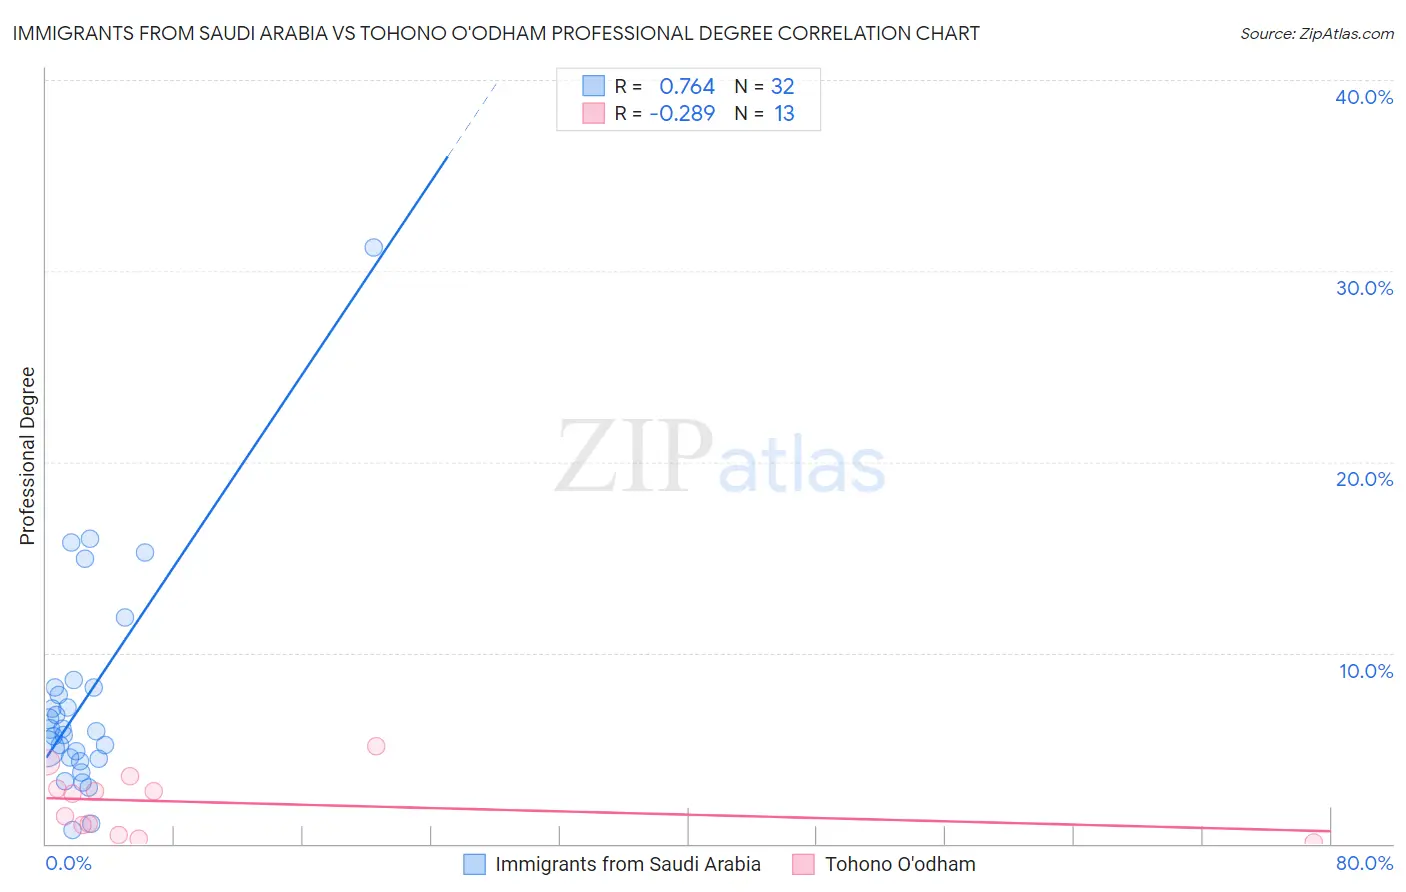
Immigrants from Saudi Arabia vs Tohono O'odham Professional Degree Correlation Chart
The statistical analysis conducted on geographies consisting of 164,208,779 people shows a strong positive correlation between the proportion of Immigrants from Saudi Arabia and percentage of population with at least professional degree education in the United States with a correlation coefficient (R) of 0.764 and weighted average of 5.9%. Similarly, the statistical analysis conducted on geographies consisting of 58,607,680 people shows a weak negative correlation between the proportion of Tohono O'odham and percentage of population with at least professional degree education in the United States with a correlation coefficient (R) of -0.289 and weighted average of 2.8%, a difference of 108.5%.
Professional Degree Correlation Summary
| Measurement | Immigrants from Saudi Arabia | Tohono O'odham |
| Minimum | 0.70% | 0.045% |
| Maximum | 31.2% | 5.1% |
| Range | 30.5% | 5.1% |
| Mean | 7.6% | 2.2% |
| Median | 5.9% | 2.6% |
| Interquartile 25% (IQ1) | 4.5% | 0.74% |
| Interquartile 75% (IQ3) | 8.2% | 3.2% |
| Interquartile Range (IQR) | 3.7% | 2.5% |
| Standard Deviation (Sample) | 5.9% | 1.6% |
| Standard Deviation (Population) | 5.8% | 1.5% |
Similar Demographics by Professional Degree
Demographics Similar to Immigrants from Saudi Arabia by Professional Degree
In terms of professional degree, the demographic groups most similar to Immigrants from Saudi Arabia are Argentinean (5.9%, a difference of 0.16%), Estonian (6.0%, a difference of 0.32%), New Zealander (6.0%, a difference of 0.33%), Cambodian (6.0%, a difference of 0.52%), and Immigrants from South Central Asia (5.9%, a difference of 0.61%).
| Demographics | Rating | Rank | Professional Degree |
| Immigrants | Russia | 100.0 /100 | #36 | Exceptional 6.0% |
| Immigrants | Austria | 100.0 /100 | #37 | Exceptional 6.0% |
| Immigrants | Norway | 100.0 /100 | #38 | Exceptional 6.0% |
| Immigrants | South Africa | 100.0 /100 | #39 | Exceptional 6.0% |
| Cambodians | 100.0 /100 | #40 | Exceptional 6.0% |
| New Zealanders | 100.0 /100 | #41 | Exceptional 6.0% |
| Estonians | 100.0 /100 | #42 | Exceptional 6.0% |
| Immigrants | Saudi Arabia | 100.0 /100 | #43 | Exceptional 5.9% |
| Argentineans | 100.0 /100 | #44 | Exceptional 5.9% |
| Immigrants | South Central Asia | 100.0 /100 | #45 | Exceptional 5.9% |
| Immigrants | Argentina | 100.0 /100 | #46 | Exceptional 5.9% |
| Australians | 100.0 /100 | #47 | Exceptional 5.9% |
| Paraguayans | 100.0 /100 | #48 | Exceptional 5.9% |
| Immigrants | Latvia | 100.0 /100 | #49 | Exceptional 5.8% |
| Immigrants | Czechoslovakia | 100.0 /100 | #50 | Exceptional 5.8% |
Demographics Similar to Tohono O'odham by Professional Degree
In terms of professional degree, the demographic groups most similar to Tohono O'odham are Immigrants from the Azores (2.8%, a difference of 0.66%), Yup'ik (2.9%, a difference of 0.78%), Immigrants from Central America (2.9%, a difference of 0.83%), Navajo (2.9%, a difference of 0.95%), and Arapaho (2.9%, a difference of 1.0%).
| Demographics | Rating | Rank | Professional Degree |
| Puget Sound Salish | 0.0 /100 | #333 | Tragic 3.1% |
| Pennsylvania Germans | 0.0 /100 | #334 | Tragic 3.0% |
| Natives/Alaskans | 0.0 /100 | #335 | Tragic 3.0% |
| Fijians | 0.0 /100 | #336 | Tragic 2.9% |
| Arapaho | 0.0 /100 | #337 | Tragic 2.9% |
| Navajo | 0.0 /100 | #338 | Tragic 2.9% |
| Immigrants | Central America | 0.0 /100 | #339 | Tragic 2.9% |
| Yup'ik | 0.0 /100 | #340 | Tragic 2.9% |
| Tohono O'odham | 0.0 /100 | #341 | Tragic 2.8% |
| Immigrants | Azores | 0.0 /100 | #342 | Tragic 2.8% |
| Mexicans | 0.0 /100 | #343 | Tragic 2.7% |
| Spanish American Indians | 0.0 /100 | #344 | Tragic 2.7% |
| Immigrants | Mexico | 0.0 /100 | #345 | Tragic 2.6% |
| Lumbee | 0.0 /100 | #346 | Tragic 2.5% |
| Houma | 0.0 /100 | #347 | Tragic 2.2% |