Immigrants from Bahamas vs Costa Rican Family Households with Children
COMPARE
Immigrants from Bahamas
Costa Rican
Family Households with Children
Family Households with Children Comparison
Immigrants from Bahamas
Costa Ricans
26.3%
FAMILY HOUSEHOLDS WITH CHILDREN
0.1/ 100
METRIC RATING
304th/ 347
METRIC RANK
28.4%
FAMILY HOUSEHOLDS WITH CHILDREN
99.8/ 100
METRIC RATING
84th/ 347
METRIC RANK
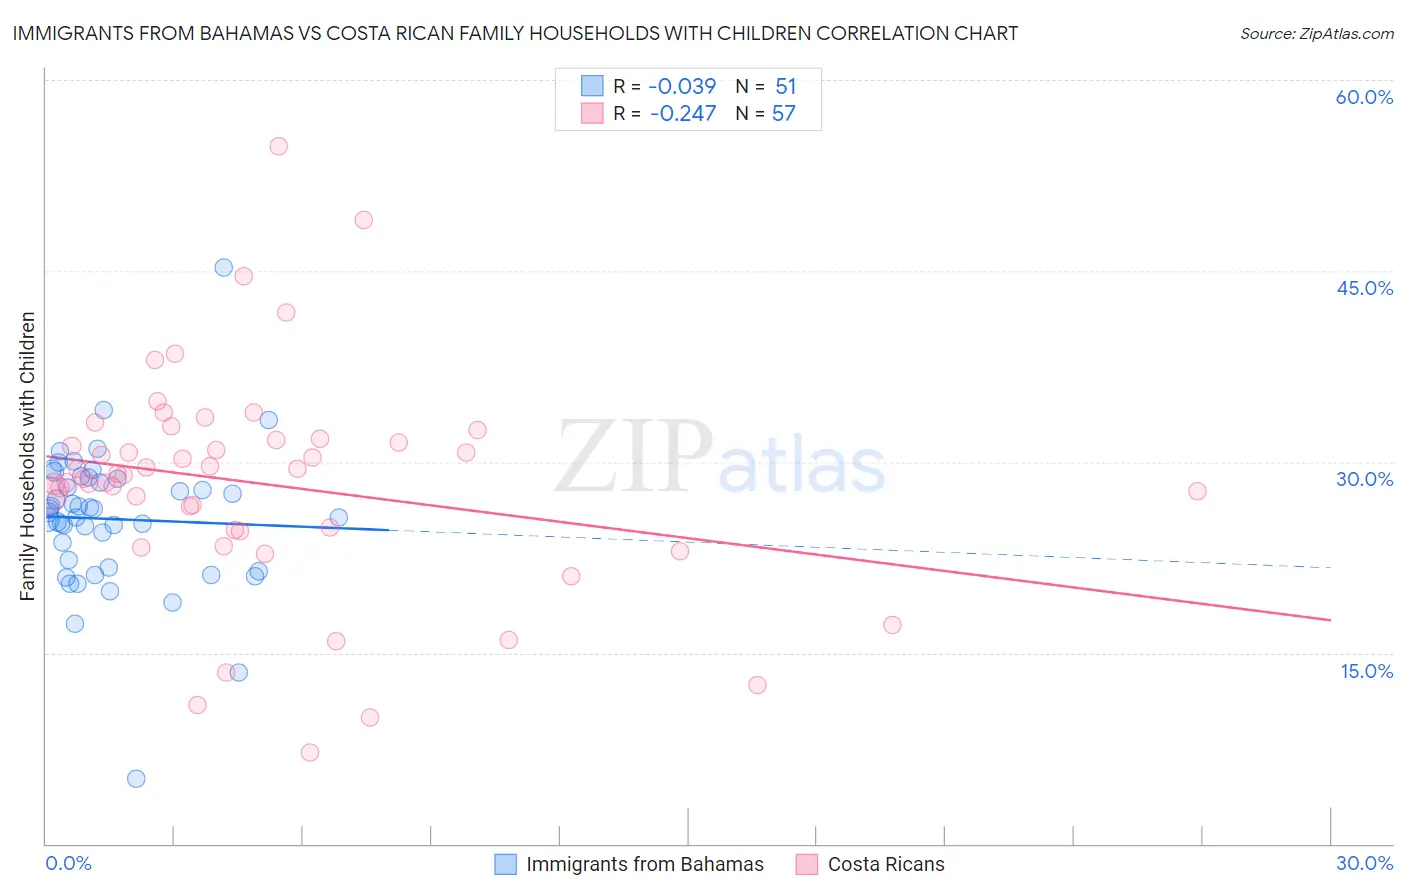
Immigrants from Bahamas vs Costa Rican Family Households with Children Correlation Chart
The statistical analysis conducted on geographies consisting of 104,549,711 people shows no correlation between the proportion of Immigrants from Bahamas and percentage of family households with children in the United States with a correlation coefficient (R) of -0.039 and weighted average of 26.3%. Similarly, the statistical analysis conducted on geographies consisting of 253,384,155 people shows a weak negative correlation between the proportion of Costa Ricans and percentage of family households with children in the United States with a correlation coefficient (R) of -0.247 and weighted average of 28.4%, a difference of 7.7%.
Family Households with Children Correlation Summary
| Measurement | Immigrants from Bahamas | Costa Rican |
| Minimum | 5.1% | 7.1% |
| Maximum | 45.3% | 54.8% |
| Range | 40.2% | 47.7% |
| Mean | 25.5% | 28.3% |
| Median | 26.0% | 29.0% |
| Interquartile 25% (IQ1) | 21.7% | 24.6% |
| Interquartile 75% (IQ3) | 28.7% | 31.7% |
| Interquartile Range (IQR) | 7.1% | 7.2% |
| Standard Deviation (Sample) | 5.7% | 8.7% |
| Standard Deviation (Population) | 5.6% | 8.6% |
Similar Demographics by Family Households with Children
Demographics Similar to Immigrants from Bahamas by Family Households with Children
In terms of family households with children, the demographic groups most similar to Immigrants from Bahamas are Guyanese (26.3%, a difference of 0.030%), Bermudan (26.3%, a difference of 0.040%), Immigrants from Guyana (26.3%, a difference of 0.050%), Serbian (26.4%, a difference of 0.080%), and Immigrants from Trinidad and Tobago (26.4%, a difference of 0.090%).
| Demographics | Rating | Rank | Family Households with Children |
| Armenians | 0.1 /100 | #297 | Tragic 26.4% |
| Immigrants | Western Europe | 0.1 /100 | #298 | Tragic 26.4% |
| Trinidadians and Tobagonians | 0.1 /100 | #299 | Tragic 26.4% |
| Paiute | 0.1 /100 | #300 | Tragic 26.4% |
| Immigrants | Trinidad and Tobago | 0.1 /100 | #301 | Tragic 26.4% |
| Serbians | 0.1 /100 | #302 | Tragic 26.4% |
| Immigrants | Guyana | 0.1 /100 | #303 | Tragic 26.3% |
| Immigrants | Bahamas | 0.1 /100 | #304 | Tragic 26.3% |
| Guyanese | 0.1 /100 | #305 | Tragic 26.3% |
| Bermudans | 0.1 /100 | #306 | Tragic 26.3% |
| West Indians | 0.0 /100 | #307 | Tragic 26.3% |
| Lumbee | 0.0 /100 | #308 | Tragic 26.3% |
| Immigrants | Somalia | 0.0 /100 | #309 | Tragic 26.3% |
| Marshallese | 0.0 /100 | #310 | Tragic 26.2% |
| Colville | 0.0 /100 | #311 | Tragic 26.2% |
Demographics Similar to Costa Ricans by Family Households with Children
In terms of family households with children, the demographic groups most similar to Costa Ricans are Nicaraguan (28.4%, a difference of 0.0%), Immigrants from Syria (28.4%, a difference of 0.020%), Kenyan (28.4%, a difference of 0.050%), South American (28.4%, a difference of 0.10%), and Native/Alaskan (28.4%, a difference of 0.12%).
| Demographics | Rating | Rank | Family Households with Children |
| Nigerians | 99.8 /100 | #77 | Exceptional 28.4% |
| Immigrants | Nepal | 99.8 /100 | #78 | Exceptional 28.4% |
| Immigrants | Iraq | 99.8 /100 | #79 | Exceptional 28.4% |
| Natives/Alaskans | 99.8 /100 | #80 | Exceptional 28.4% |
| South Americans | 99.8 /100 | #81 | Exceptional 28.4% |
| Kenyans | 99.8 /100 | #82 | Exceptional 28.4% |
| Nicaraguans | 99.8 /100 | #83 | Exceptional 28.4% |
| Costa Ricans | 99.8 /100 | #84 | Exceptional 28.4% |
| Immigrants | Syria | 99.8 /100 | #85 | Exceptional 28.4% |
| Immigrants | Western Africa | 99.6 /100 | #86 | Exceptional 28.3% |
| Colombians | 99.6 /100 | #87 | Exceptional 28.3% |
| Liberians | 99.6 /100 | #88 | Exceptional 28.3% |
| Immigrants | Costa Rica | 99.6 /100 | #89 | Exceptional 28.3% |
| Immigrants | Thailand | 99.5 /100 | #90 | Exceptional 28.2% |
| Immigrants | Liberia | 99.4 /100 | #91 | Exceptional 28.2% |