Immigrants from Austria vs Choctaw In Labor Force | Age 30-34
COMPARE
Immigrants from Austria
Choctaw
In Labor Force | Age 30-34
In Labor Force | Age 30-34 Comparison
Immigrants from Austria
Choctaw
85.2%
IN LABOR FORCE | AGE 30-34
96.8/ 100
METRIC RATING
102nd/ 347
METRIC RANK
81.4%
IN LABOR FORCE | AGE 30-34
0.0/ 100
METRIC RATING
318th/ 347
METRIC RANK
Immigrants from Austria vs Choctaw In Labor Force | Age 30-34 Correlation Chart
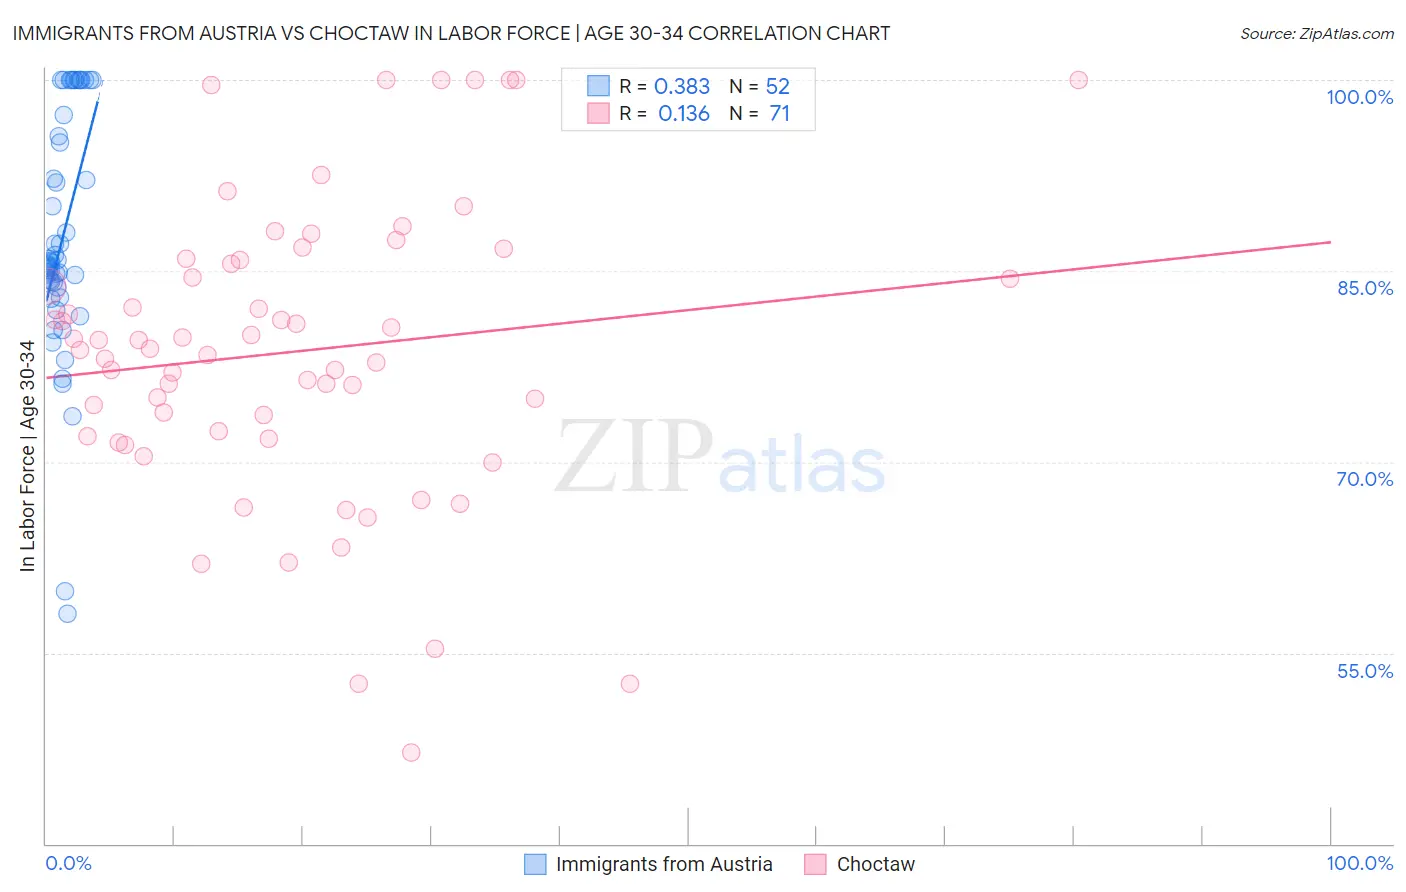
The statistical analysis conducted on geographies consisting of 167,940,760 people shows a mild positive correlation between the proportion of Immigrants from Austria and labor force participation rate among population between the ages 30 and 34 in the United States with a correlation coefficient (R) of 0.383 and weighted average of 85.2%. Similarly, the statistical analysis conducted on geographies consisting of 269,615,470 people shows a poor positive correlation between the proportion of Choctaw and labor force participation rate among population between the ages 30 and 34 in the United States with a correlation coefficient (R) of 0.136 and weighted average of 81.4%, a difference of 4.6%.
In Labor Force | Age 30-34 Correlation Summary
| Measurement | Immigrants from Austria | Choctaw |
| Minimum | 58.1% | 47.2% |
| Maximum | 100.0% | 100.0% |
| Range | 41.9% | 52.8% |
| Mean | 87.6% | 78.7% |
| Median | 85.7% | 78.9% |
| Interquartile 25% (IQ1) | 83.3% | 72.0% |
| Interquartile 75% (IQ3) | 96.4% | 85.9% |
| Interquartile Range (IQR) | 13.1% | 13.9% |
| Standard Deviation (Sample) | 9.6% | 11.6% |
| Standard Deviation (Population) | 9.5% | 11.5% |
Similar Demographics by In Labor Force | Age 30-34
Demographics Similar to Immigrants from Austria by In Labor Force | Age 30-34
In terms of in labor force | age 30-34, the demographic groups most similar to Immigrants from Austria are Immigrants from Belarus (85.2%, a difference of 0.010%), Ukrainian (85.2%, a difference of 0.010%), Immigrants from Ghana (85.2%, a difference of 0.010%), Belgian (85.2%, a difference of 0.020%), and Sudanese (85.2%, a difference of 0.020%).
| Demographics | Rating | Rank | In Labor Force | Age 30-34 |
| Immigrants | India | 97.4 /100 | #95 | Exceptional 85.2% |
| Immigrants | Korea | 97.3 /100 | #96 | Exceptional 85.2% |
| Thais | 97.2 /100 | #97 | Exceptional 85.2% |
| Immigrants | Uganda | 97.2 /100 | #98 | Exceptional 85.2% |
| Belgians | 97.2 /100 | #99 | Exceptional 85.2% |
| Sudanese | 97.1 /100 | #100 | Exceptional 85.2% |
| Immigrants | Belarus | 96.9 /100 | #101 | Exceptional 85.2% |
| Immigrants | Austria | 96.8 /100 | #102 | Exceptional 85.2% |
| Ukrainians | 96.6 /100 | #103 | Exceptional 85.2% |
| Immigrants | Ghana | 96.5 /100 | #104 | Exceptional 85.2% |
| Alsatians | 96.3 /100 | #105 | Exceptional 85.2% |
| Immigrants | Middle Africa | 96.3 /100 | #106 | Exceptional 85.2% |
| Immigrants | Northern Africa | 96.3 /100 | #107 | Exceptional 85.2% |
| Immigrants | Zimbabwe | 95.8 /100 | #108 | Exceptional 85.1% |
| Argentineans | 95.8 /100 | #109 | Exceptional 85.1% |
Demographics Similar to Choctaw by In Labor Force | Age 30-34
In terms of in labor force | age 30-34, the demographic groups most similar to Choctaw are Shoshone (81.4%, a difference of 0.0%), Yaqui (81.4%, a difference of 0.020%), Immigrants from the Azores (81.5%, a difference of 0.080%), Arapaho (81.5%, a difference of 0.080%), and Alaska Native (81.3%, a difference of 0.10%).
| Demographics | Rating | Rank | In Labor Force | Age 30-34 |
| Chickasaw | 0.0 /100 | #311 | Tragic 81.9% |
| Mexicans | 0.0 /100 | #312 | Tragic 81.9% |
| Iroquois | 0.0 /100 | #313 | Tragic 81.9% |
| Alaskan Athabascans | 0.0 /100 | #314 | Tragic 81.7% |
| Cherokee | 0.0 /100 | #315 | Tragic 81.6% |
| Immigrants | Azores | 0.0 /100 | #316 | Tragic 81.5% |
| Arapaho | 0.0 /100 | #317 | Tragic 81.5% |
| Choctaw | 0.0 /100 | #318 | Tragic 81.4% |
| Shoshone | 0.0 /100 | #319 | Tragic 81.4% |
| Yaqui | 0.0 /100 | #320 | Tragic 81.4% |
| Alaska Natives | 0.0 /100 | #321 | Tragic 81.3% |
| Puerto Ricans | 0.0 /100 | #322 | Tragic 81.2% |
| Paiute | 0.0 /100 | #323 | Tragic 81.2% |
| Cheyenne | 0.0 /100 | #324 | Tragic 81.1% |
| Dutch West Indians | 0.0 /100 | #325 | Tragic 81.0% |