Immigrants from Trinidad and Tobago vs Immigrants from Burma/Myanmar 8th Grade
COMPARE
Immigrants from Trinidad and Tobago
Immigrants from Burma/Myanmar
8th Grade
8th Grade Comparison
Immigrants from Trinidad and Tobago
Immigrants from Burma/Myanmar
94.6%
8TH GRADE
0.1/ 100
METRIC RATING
279th/ 347
METRIC RANK
94.1%
8TH GRADE
0.0/ 100
METRIC RATING
300th/ 347
METRIC RANK
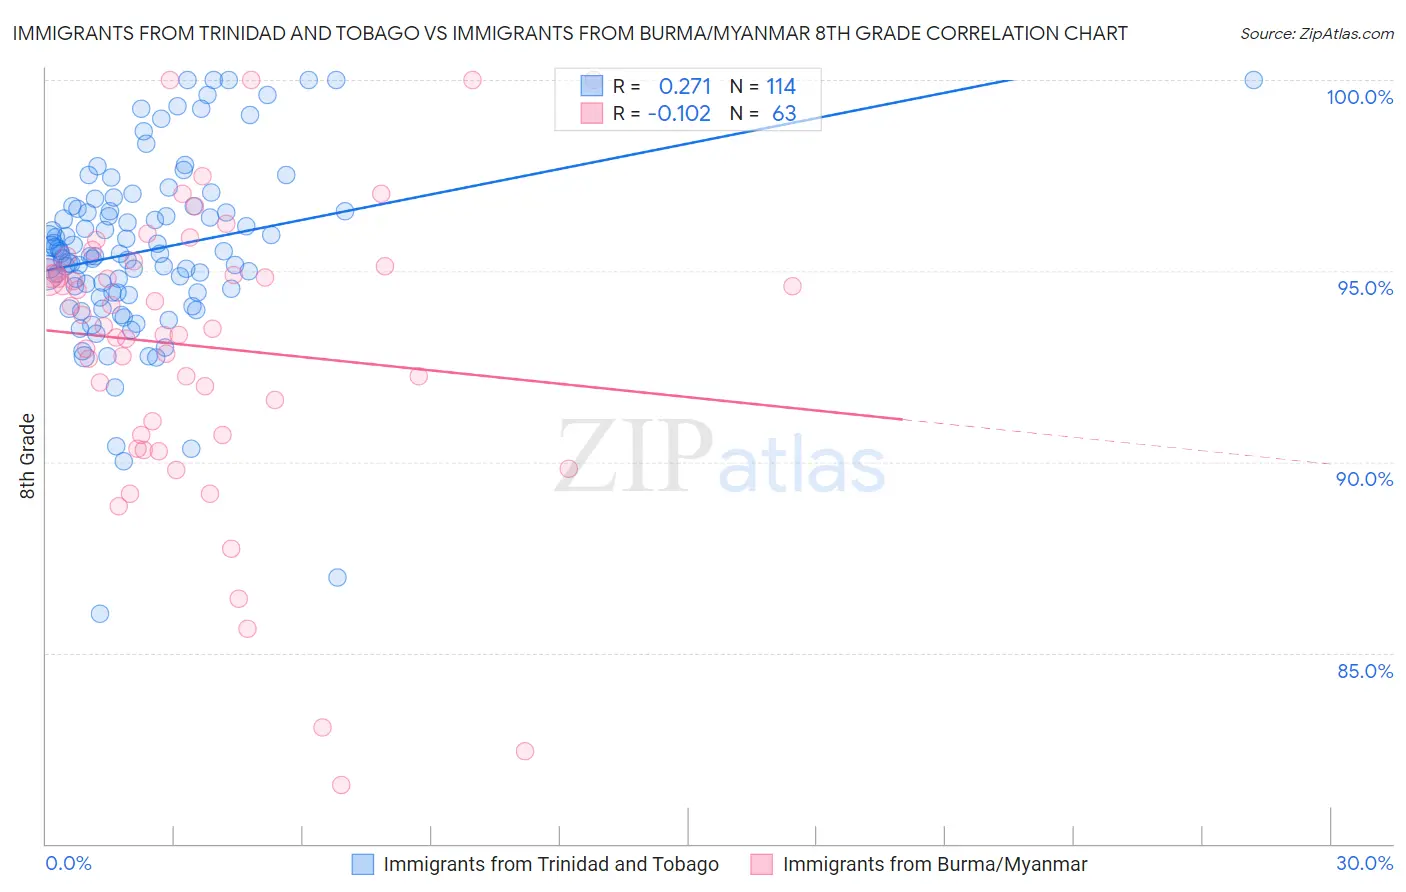
Immigrants from Trinidad and Tobago vs Immigrants from Burma/Myanmar 8th Grade Correlation Chart
The statistical analysis conducted on geographies consisting of 223,526,834 people shows a weak positive correlation between the proportion of Immigrants from Trinidad and Tobago and percentage of population with at least 8th grade education in the United States with a correlation coefficient (R) of 0.271 and weighted average of 94.6%. Similarly, the statistical analysis conducted on geographies consisting of 172,345,696 people shows a poor negative correlation between the proportion of Immigrants from Burma/Myanmar and percentage of population with at least 8th grade education in the United States with a correlation coefficient (R) of -0.102 and weighted average of 94.1%, a difference of 0.56%.
8th Grade Correlation Summary
| Measurement | Immigrants from Trinidad and Tobago | Immigrants from Burma/Myanmar |
| Minimum | 86.0% | 81.5% |
| Maximum | 100.0% | 100.0% |
| Range | 14.0% | 18.5% |
| Mean | 95.5% | 93.0% |
| Median | 95.5% | 93.5% |
| Interquartile 25% (IQ1) | 94.4% | 90.7% |
| Interquartile 75% (IQ3) | 96.6% | 95.1% |
| Interquartile Range (IQR) | 2.2% | 4.4% |
| Standard Deviation (Sample) | 2.4% | 3.9% |
| Standard Deviation (Population) | 2.4% | 3.9% |
Similar Demographics by 8th Grade
Demographics Similar to Immigrants from Trinidad and Tobago by 8th Grade
In terms of 8th grade, the demographic groups most similar to Immigrants from Trinidad and Tobago are Barbadian (94.6%, a difference of 0.0%), Armenian (94.7%, a difference of 0.010%), Immigrants from Bolivia (94.6%, a difference of 0.010%), Taiwanese (94.7%, a difference of 0.040%), and Immigrants from Eritrea (94.6%, a difference of 0.050%).
| Demographics | Rating | Rank | 8th Grade |
| Immigrants | South America | 0.2 /100 | #272 | Tragic 94.8% |
| Immigrants | Western Africa | 0.2 /100 | #273 | Tragic 94.8% |
| Trinidadians and Tobagonians | 0.2 /100 | #274 | Tragic 94.7% |
| Immigrants | Colombia | 0.2 /100 | #275 | Tragic 94.7% |
| Peruvians | 0.1 /100 | #276 | Tragic 94.7% |
| Taiwanese | 0.1 /100 | #277 | Tragic 94.7% |
| Armenians | 0.1 /100 | #278 | Tragic 94.7% |
| Immigrants | Trinidad and Tobago | 0.1 /100 | #279 | Tragic 94.6% |
| Barbadians | 0.1 /100 | #280 | Tragic 94.6% |
| Immigrants | Bolivia | 0.1 /100 | #281 | Tragic 94.6% |
| Immigrants | Eritrea | 0.1 /100 | #282 | Tragic 94.6% |
| Immigrants | St. Vincent and the Grenadines | 0.1 /100 | #283 | Tragic 94.6% |
| Immigrants | Philippines | 0.1 /100 | #284 | Tragic 94.6% |
| Immigrants | Barbados | 0.0 /100 | #285 | Tragic 94.5% |
| Immigrants | Peru | 0.0 /100 | #286 | Tragic 94.5% |
Demographics Similar to Immigrants from Burma/Myanmar by 8th Grade
In terms of 8th grade, the demographic groups most similar to Immigrants from Burma/Myanmar are Cuban (94.1%, a difference of 0.010%), Immigrants from Laos (94.1%, a difference of 0.020%), Indonesian (94.1%, a difference of 0.030%), Immigrants from South Eastern Asia (94.2%, a difference of 0.070%), and Haitian (94.2%, a difference of 0.080%).
| Demographics | Rating | Rank | 8th Grade |
| Yaqui | 0.0 /100 | #293 | Tragic 94.2% |
| Houma | 0.0 /100 | #294 | Tragic 94.2% |
| Fijians | 0.0 /100 | #295 | Tragic 94.2% |
| Haitians | 0.0 /100 | #296 | Tragic 94.2% |
| Immigrants | South Eastern Asia | 0.0 /100 | #297 | Tragic 94.2% |
| Indonesians | 0.0 /100 | #298 | Tragic 94.1% |
| Cubans | 0.0 /100 | #299 | Tragic 94.1% |
| Immigrants | Burma/Myanmar | 0.0 /100 | #300 | Tragic 94.1% |
| Immigrants | Laos | 0.0 /100 | #301 | Tragic 94.1% |
| Sri Lankans | 0.0 /100 | #302 | Tragic 94.0% |
| Immigrants | Dominica | 0.0 /100 | #303 | Tragic 94.0% |
| Guyanese | 0.0 /100 | #304 | Tragic 93.9% |
| Immigrants | Haiti | 0.0 /100 | #305 | Tragic 93.9% |
| Immigrants | Guyana | 0.0 /100 | #306 | Tragic 93.8% |
| Immigrants | Portugal | 0.0 /100 | #307 | Tragic 93.8% |