Immigrants from Asia vs Immigrants from Liberia 8th Grade
COMPARE
Immigrants from Asia
Immigrants from Liberia
8th Grade
8th Grade Comparison
Immigrants from Asia
Immigrants from Liberia
95.2%
8TH GRADE
3.1/ 100
METRIC RATING
233rd/ 347
METRIC RANK
95.4%
8TH GRADE
8.9/ 100
METRIC RATING
215th/ 347
METRIC RANK
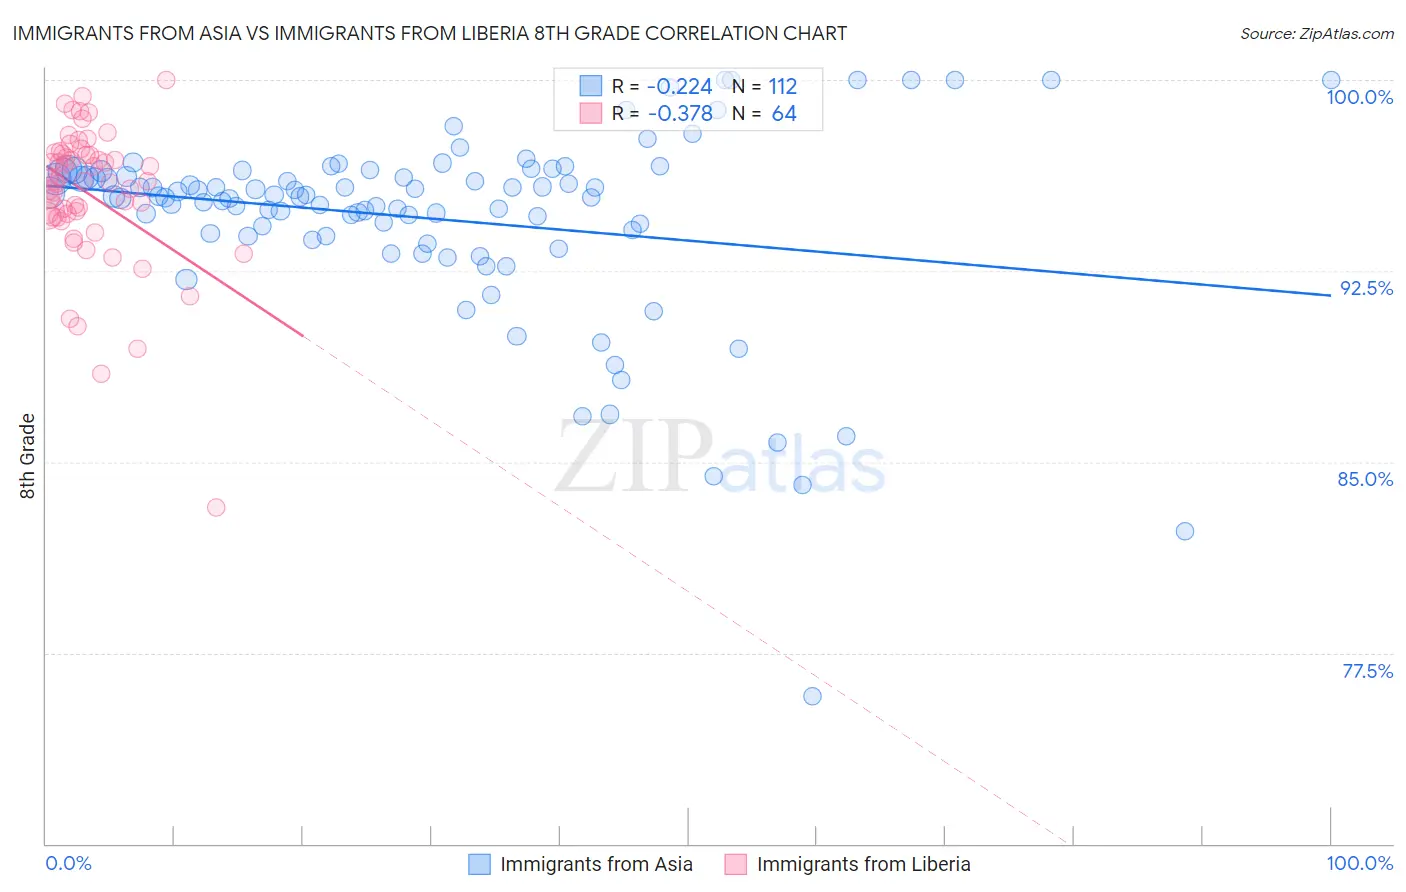
Immigrants from Asia vs Immigrants from Liberia 8th Grade Correlation Chart
The statistical analysis conducted on geographies consisting of 549,167,442 people shows a weak negative correlation between the proportion of Immigrants from Asia and percentage of population with at least 8th grade education in the United States with a correlation coefficient (R) of -0.224 and weighted average of 95.2%. Similarly, the statistical analysis conducted on geographies consisting of 135,294,272 people shows a mild negative correlation between the proportion of Immigrants from Liberia and percentage of population with at least 8th grade education in the United States with a correlation coefficient (R) of -0.378 and weighted average of 95.4%, a difference of 0.18%.
8th Grade Correlation Summary
| Measurement | Immigrants from Asia | Immigrants from Liberia |
| Minimum | 75.8% | 83.2% |
| Maximum | 100.0% | 100.0% |
| Range | 24.2% | 16.8% |
| Mean | 94.6% | 95.5% |
| Median | 95.4% | 96.0% |
| Interquartile 25% (IQ1) | 93.9% | 94.7% |
| Interquartile 75% (IQ3) | 96.4% | 97.1% |
| Interquartile Range (IQR) | 2.5% | 2.4% |
| Standard Deviation (Sample) | 3.8% | 2.8% |
| Standard Deviation (Population) | 3.8% | 2.8% |
Demographics Similar to Immigrants from Asia and Immigrants from Liberia by 8th Grade
In terms of 8th grade, the demographic groups most similar to Immigrants from Asia are Costa Rican (95.2%, a difference of 0.0%), Indian (Asian) (95.2%, a difference of 0.010%), Asian (95.2%, a difference of 0.020%), Immigrants from Panama (95.2%, a difference of 0.050%), and Immigrants from Indonesia (95.3%, a difference of 0.060%). Similarly, the demographic groups most similar to Immigrants from Liberia are Immigrants from Chile (95.4%, a difference of 0.0%), Samoan (95.4%, a difference of 0.010%), Immigrants from Eastern Asia (95.4%, a difference of 0.010%), Dutch West Indian (95.4%, a difference of 0.020%), and Spanish American (95.4%, a difference of 0.020%).
| Demographics | Rating | Rank | 8th Grade |
| Immigrants | Chile | 9.0 /100 | #214 | Tragic 95.4% |
| Immigrants | Liberia | 8.9 /100 | #215 | Tragic 95.4% |
| Samoans | 8.4 /100 | #216 | Tragic 95.4% |
| Immigrants | Eastern Asia | 8.3 /100 | #217 | Tragic 95.4% |
| Dutch West Indians | 8.1 /100 | #218 | Tragic 95.4% |
| Spanish Americans | 8.0 /100 | #219 | Tragic 95.4% |
| Immigrants | Southern Europe | 7.7 /100 | #220 | Tragic 95.3% |
| Immigrants | Syria | 7.4 /100 | #221 | Tragic 95.3% |
| Immigrants | Malaysia | 7.3 /100 | #222 | Tragic 95.3% |
| Immigrants | Oceania | 7.1 /100 | #223 | Tragic 95.3% |
| Immigrants | Western Asia | 6.0 /100 | #224 | Tragic 95.3% |
| Sub-Saharan Africans | 6.0 /100 | #225 | Tragic 95.3% |
| Navajo | 5.7 /100 | #226 | Tragic 95.3% |
| Bahamians | 5.6 /100 | #227 | Tragic 95.3% |
| Immigrants | Eastern Africa | 5.6 /100 | #228 | Tragic 95.3% |
| Immigrants | Indonesia | 4.4 /100 | #229 | Tragic 95.3% |
| Immigrants | Panama | 4.1 /100 | #230 | Tragic 95.2% |
| Asians | 3.5 /100 | #231 | Tragic 95.2% |
| Indians (Asian) | 3.3 /100 | #232 | Tragic 95.2% |
| Immigrants | Asia | 3.1 /100 | #233 | Tragic 95.2% |
| Costa Ricans | 3.0 /100 | #234 | Tragic 95.2% |