Black/African American vs Immigrants from Burma/Myanmar 8th Grade
COMPARE
Black/African American
Immigrants from Burma/Myanmar
8th Grade
8th Grade Comparison
Blacks/African Americans
Immigrants from Burma/Myanmar
95.6%
8TH GRADE
34.8/ 100
METRIC RATING
185th/ 347
METRIC RANK
94.1%
8TH GRADE
0.0/ 100
METRIC RATING
300th/ 347
METRIC RANK
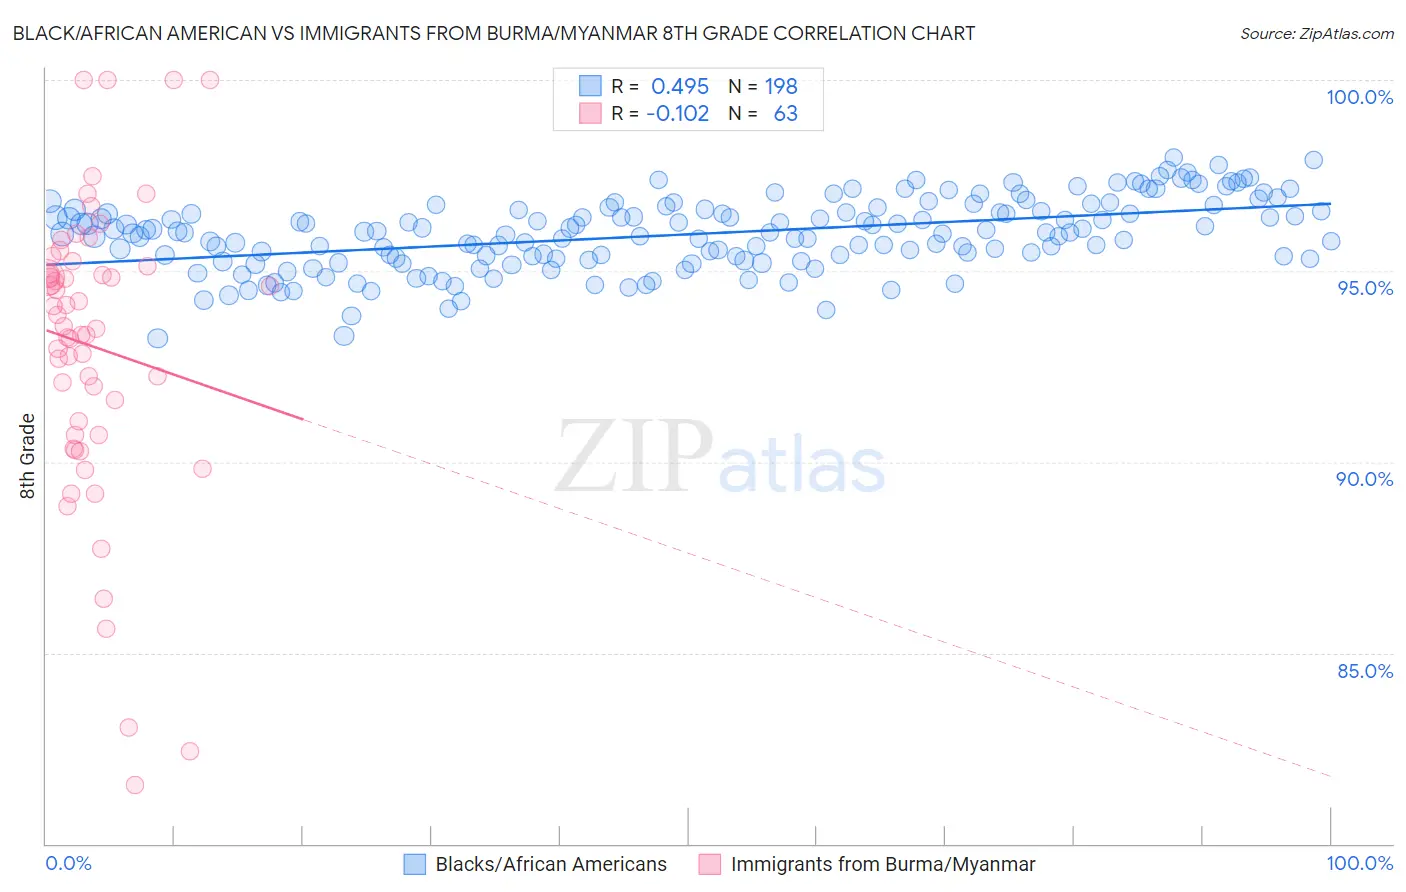
Black/African American vs Immigrants from Burma/Myanmar 8th Grade Correlation Chart
The statistical analysis conducted on geographies consisting of 561,177,341 people shows a moderate positive correlation between the proportion of Blacks/African Americans and percentage of population with at least 8th grade education in the United States with a correlation coefficient (R) of 0.495 and weighted average of 95.6%. Similarly, the statistical analysis conducted on geographies consisting of 172,345,696 people shows a poor negative correlation between the proportion of Immigrants from Burma/Myanmar and percentage of population with at least 8th grade education in the United States with a correlation coefficient (R) of -0.102 and weighted average of 94.1%, a difference of 1.6%.
8th Grade Correlation Summary
| Measurement | Black/African American | Immigrants from Burma/Myanmar |
| Minimum | 93.2% | 81.5% |
| Maximum | 98.0% | 100.0% |
| Range | 4.7% | 18.5% |
| Mean | 96.0% | 93.0% |
| Median | 96.0% | 93.5% |
| Interquartile 25% (IQ1) | 95.3% | 90.7% |
| Interquartile 75% (IQ3) | 96.6% | 95.1% |
| Interquartile Range (IQR) | 1.3% | 4.4% |
| Standard Deviation (Sample) | 0.93% | 3.9% |
| Standard Deviation (Population) | 0.93% | 3.9% |
Similar Demographics by 8th Grade
Demographics Similar to Blacks/African Americans by 8th Grade
In terms of 8th grade, the demographic groups most similar to Blacks/African Americans are Brazilian (95.6%, a difference of 0.0%), Immigrants from Iraq (95.6%, a difference of 0.010%), Immigrants from Uganda (95.6%, a difference of 0.010%), Sudanese (95.6%, a difference of 0.010%), and Immigrants from Egypt (95.7%, a difference of 0.020%).
| Demographics | Rating | Rank | 8th Grade |
| Venezuelans | 47.5 /100 | #178 | Average 95.7% |
| Immigrants | Brazil | 45.4 /100 | #179 | Average 95.7% |
| Iraqis | 40.5 /100 | #180 | Average 95.7% |
| Immigrants | Spain | 38.7 /100 | #181 | Fair 95.7% |
| Immigrants | Egypt | 37.9 /100 | #182 | Fair 95.7% |
| Immigrants | Iraq | 36.2 /100 | #183 | Fair 95.6% |
| Immigrants | Uganda | 36.0 /100 | #184 | Fair 95.6% |
| Blacks/African Americans | 34.8 /100 | #185 | Fair 95.6% |
| Brazilians | 34.8 /100 | #186 | Fair 95.6% |
| Sudanese | 33.0 /100 | #187 | Fair 95.6% |
| Liberians | 32.4 /100 | #188 | Fair 95.6% |
| Immigrants | Micronesia | 31.6 /100 | #189 | Fair 95.6% |
| Immigrants | Venezuela | 30.8 /100 | #190 | Fair 95.6% |
| Immigrants | Nepal | 30.2 /100 | #191 | Fair 95.6% |
| Pima | 28.6 /100 | #192 | Fair 95.6% |
Demographics Similar to Immigrants from Burma/Myanmar by 8th Grade
In terms of 8th grade, the demographic groups most similar to Immigrants from Burma/Myanmar are Cuban (94.1%, a difference of 0.010%), Immigrants from Laos (94.1%, a difference of 0.020%), Indonesian (94.1%, a difference of 0.030%), Immigrants from South Eastern Asia (94.2%, a difference of 0.070%), and Haitian (94.2%, a difference of 0.080%).
| Demographics | Rating | Rank | 8th Grade |
| Yaqui | 0.0 /100 | #293 | Tragic 94.2% |
| Houma | 0.0 /100 | #294 | Tragic 94.2% |
| Fijians | 0.0 /100 | #295 | Tragic 94.2% |
| Haitians | 0.0 /100 | #296 | Tragic 94.2% |
| Immigrants | South Eastern Asia | 0.0 /100 | #297 | Tragic 94.2% |
| Indonesians | 0.0 /100 | #298 | Tragic 94.1% |
| Cubans | 0.0 /100 | #299 | Tragic 94.1% |
| Immigrants | Burma/Myanmar | 0.0 /100 | #300 | Tragic 94.1% |
| Immigrants | Laos | 0.0 /100 | #301 | Tragic 94.1% |
| Sri Lankans | 0.0 /100 | #302 | Tragic 94.0% |
| Immigrants | Dominica | 0.0 /100 | #303 | Tragic 94.0% |
| Guyanese | 0.0 /100 | #304 | Tragic 93.9% |
| Immigrants | Haiti | 0.0 /100 | #305 | Tragic 93.9% |
| Immigrants | Guyana | 0.0 /100 | #306 | Tragic 93.8% |
| Immigrants | Portugal | 0.0 /100 | #307 | Tragic 93.8% |