Immigrants from Asia vs French 8th Grade
COMPARE
Immigrants from Asia
French
8th Grade
8th Grade Comparison
Immigrants from Asia
French
95.2%
8TH GRADE
3.1/ 100
METRIC RATING
233rd/ 347
METRIC RANK
97.1%
8TH GRADE
100.0/ 100
METRIC RATING
26th/ 347
METRIC RANK
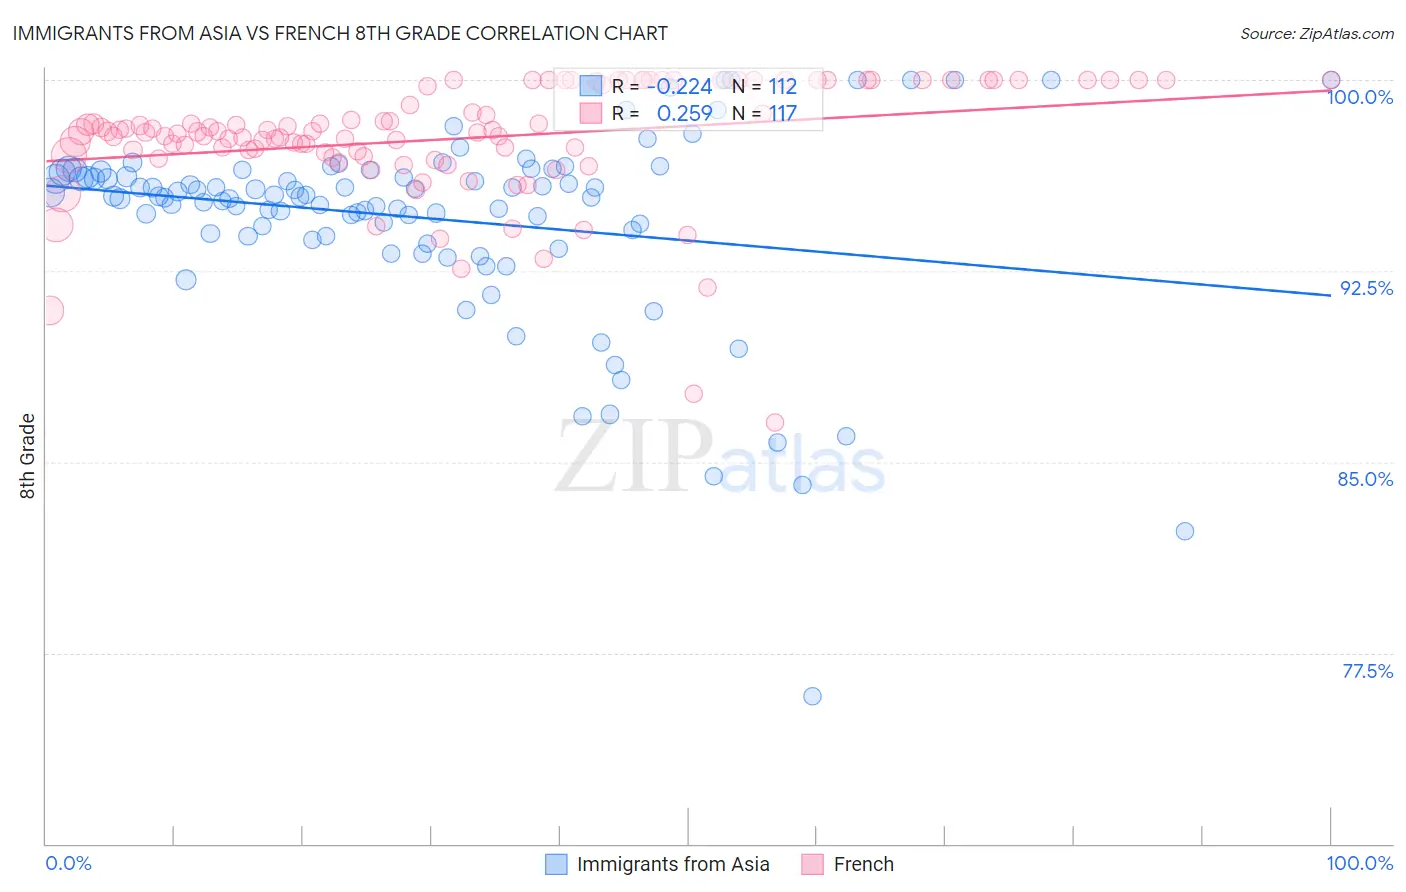
Immigrants from Asia vs French 8th Grade Correlation Chart
The statistical analysis conducted on geographies consisting of 549,167,442 people shows a weak negative correlation between the proportion of Immigrants from Asia and percentage of population with at least 8th grade education in the United States with a correlation coefficient (R) of -0.224 and weighted average of 95.2%. Similarly, the statistical analysis conducted on geographies consisting of 572,427,255 people shows a weak positive correlation between the proportion of French and percentage of population with at least 8th grade education in the United States with a correlation coefficient (R) of 0.259 and weighted average of 97.1%, a difference of 2.0%.
8th Grade Correlation Summary
| Measurement | Immigrants from Asia | French |
| Minimum | 75.8% | 86.6% |
| Maximum | 100.0% | 100.0% |
| Range | 24.2% | 13.4% |
| Mean | 94.6% | 97.7% |
| Median | 95.4% | 98.0% |
| Interquartile 25% (IQ1) | 93.9% | 97.1% |
| Interquartile 75% (IQ3) | 96.4% | 100.0% |
| Interquartile Range (IQR) | 2.5% | 2.9% |
| Standard Deviation (Sample) | 3.8% | 2.4% |
| Standard Deviation (Population) | 3.8% | 2.3% |
Similar Demographics by 8th Grade
Demographics Similar to Immigrants from Asia by 8th Grade
In terms of 8th grade, the demographic groups most similar to Immigrants from Asia are Costa Rican (95.2%, a difference of 0.0%), Indian (Asian) (95.2%, a difference of 0.010%), Nigerian (95.2%, a difference of 0.010%), Asian (95.2%, a difference of 0.020%), and Senegalese (95.2%, a difference of 0.020%).
| Demographics | Rating | Rank | 8th Grade |
| Navajo | 5.7 /100 | #226 | Tragic 95.3% |
| Bahamians | 5.6 /100 | #227 | Tragic 95.3% |
| Immigrants | Eastern Africa | 5.6 /100 | #228 | Tragic 95.3% |
| Immigrants | Indonesia | 4.4 /100 | #229 | Tragic 95.3% |
| Immigrants | Panama | 4.1 /100 | #230 | Tragic 95.2% |
| Asians | 3.5 /100 | #231 | Tragic 95.2% |
| Indians (Asian) | 3.3 /100 | #232 | Tragic 95.2% |
| Immigrants | Asia | 3.1 /100 | #233 | Tragic 95.2% |
| Costa Ricans | 3.0 /100 | #234 | Tragic 95.2% |
| Nigerians | 2.9 /100 | #235 | Tragic 95.2% |
| Senegalese | 2.7 /100 | #236 | Tragic 95.2% |
| Immigrants | Africa | 2.7 /100 | #237 | Tragic 95.2% |
| Natives/Alaskans | 2.3 /100 | #238 | Tragic 95.2% |
| Immigrants | Sierra Leone | 2.1 /100 | #239 | Tragic 95.1% |
| Ethiopians | 2.0 /100 | #240 | Tragic 95.1% |
Demographics Similar to French by 8th Grade
In terms of 8th grade, the demographic groups most similar to French are Czech (97.1%, a difference of 0.0%), Scandinavian (97.2%, a difference of 0.010%), French Canadian (97.2%, a difference of 0.020%), Scotch-Irish (97.1%, a difference of 0.020%), and Welsh (97.2%, a difference of 0.030%).
| Demographics | Rating | Rank | 8th Grade |
| Scottish | 100.0 /100 | #19 | Exceptional 97.3% |
| Croatians | 100.0 /100 | #20 | Exceptional 97.2% |
| Danes | 100.0 /100 | #21 | Exceptional 97.2% |
| Welsh | 100.0 /100 | #22 | Exceptional 97.2% |
| French Canadians | 100.0 /100 | #23 | Exceptional 97.2% |
| Scandinavians | 100.0 /100 | #24 | Exceptional 97.2% |
| Czechs | 100.0 /100 | #25 | Exceptional 97.1% |
| French | 100.0 /100 | #26 | Exceptional 97.1% |
| Scotch-Irish | 100.0 /100 | #27 | Exceptional 97.1% |
| Italians | 100.0 /100 | #28 | Exceptional 97.1% |
| Europeans | 100.0 /100 | #29 | Exceptional 97.1% |
| Sioux | 100.0 /100 | #30 | Exceptional 97.1% |
| Chippewa | 100.0 /100 | #31 | Exceptional 97.1% |
| Yup'ik | 100.0 /100 | #32 | Exceptional 97.0% |
| Swiss | 100.0 /100 | #33 | Exceptional 97.0% |