Immigrants from Armenia vs Polish College, 1 year or more
COMPARE
Immigrants from Armenia
Polish
College, 1 year or more
College, 1 year or more Comparison
Immigrants from Armenia
Poles
60.0%
COLLEGE, 1 YEAR OR MORE
68.8/ 100
METRIC RATING
157th/ 347
METRIC RANK
60.7%
COLLEGE, 1 YEAR OR MORE
82.8/ 100
METRIC RATING
142nd/ 347
METRIC RANK
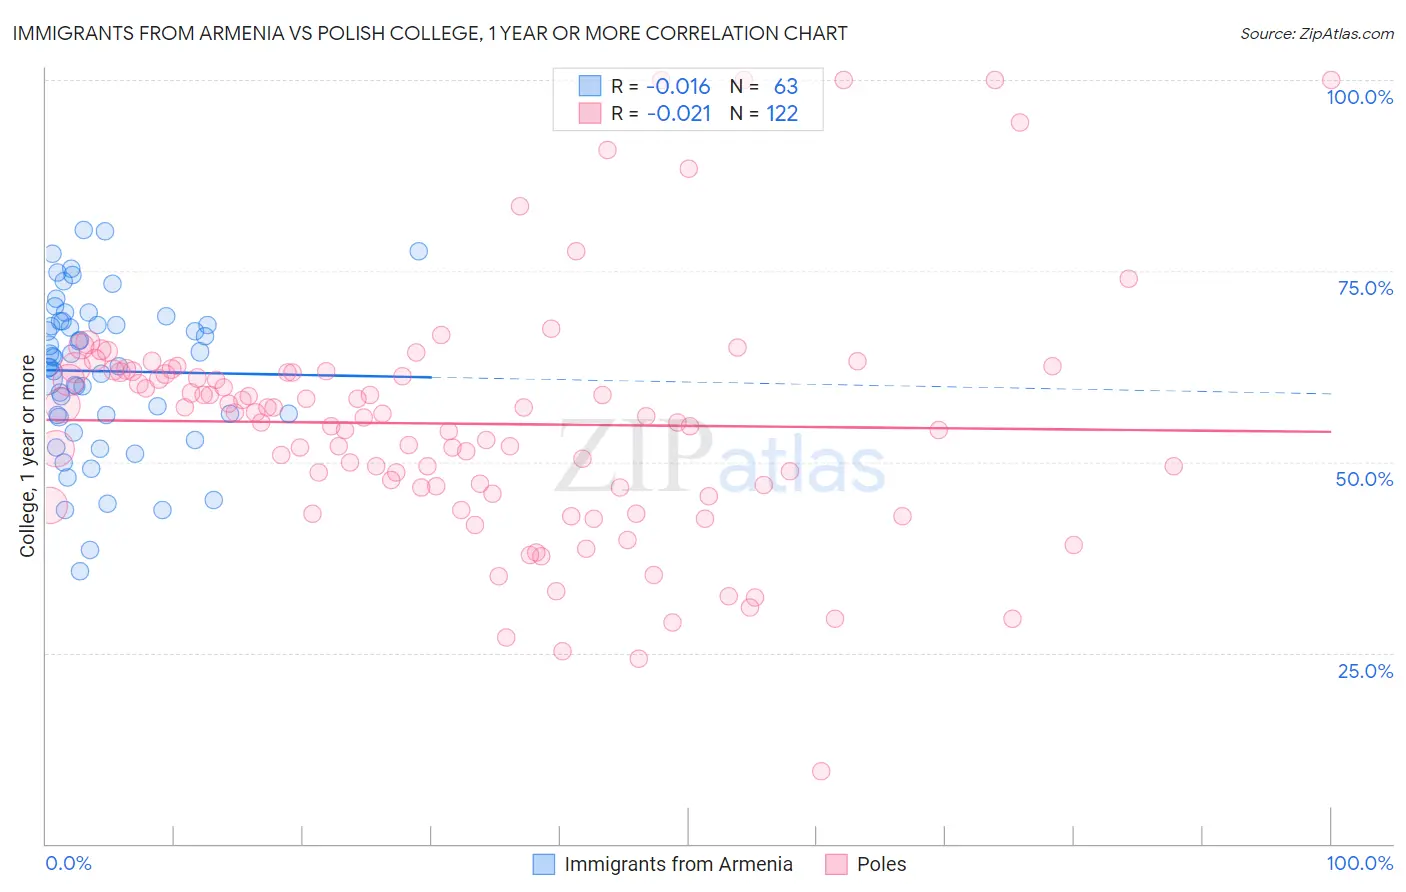
Immigrants from Armenia vs Polish College, 1 year or more Correlation Chart
The statistical analysis conducted on geographies consisting of 97,725,183 people shows no correlation between the proportion of Immigrants from Armenia and percentage of population with at least college, 1 year or more education in the United States with a correlation coefficient (R) of -0.016 and weighted average of 60.0%. Similarly, the statistical analysis conducted on geographies consisting of 560,585,948 people shows no correlation between the proportion of Poles and percentage of population with at least college, 1 year or more education in the United States with a correlation coefficient (R) of -0.021 and weighted average of 60.7%, a difference of 1.0%.
College, 1 year or more Correlation Summary
| Measurement | Immigrants from Armenia | Polish |
| Minimum | 35.7% | 9.5% |
| Maximum | 80.4% | 100.0% |
| Range | 44.7% | 90.5% |
| Mean | 61.9% | 55.0% |
| Median | 63.7% | 55.9% |
| Interquartile 25% (IQ1) | 56.2% | 46.6% |
| Interquartile 75% (IQ3) | 68.3% | 61.7% |
| Interquartile Range (IQR) | 12.2% | 15.1% |
| Standard Deviation (Sample) | 10.1% | 16.1% |
| Standard Deviation (Population) | 10.0% | 16.0% |
Demographics Similar to Immigrants from Armenia and Poles by College, 1 year or more
In terms of college, 1 year or more, the demographic groups most similar to Immigrants from Armenia are English (60.0%, a difference of 0.10%), Immigrants from Iraq (60.0%, a difference of 0.11%), Sudanese (60.2%, a difference of 0.26%), Moroccan (60.2%, a difference of 0.26%), and Finnish (60.2%, a difference of 0.26%). Similarly, the demographic groups most similar to Poles are Canadian (60.6%, a difference of 0.010%), Immigrants from Afghanistan (60.7%, a difference of 0.030%), Iraqi (60.7%, a difference of 0.050%), Czech (60.6%, a difference of 0.080%), and Immigrants from Eritrea (60.7%, a difference of 0.14%).
| Demographics | Rating | Rank | College, 1 year or more |
| Immigrants | Eritrea | 84.3 /100 | #139 | Excellent 60.7% |
| Iraqis | 83.3 /100 | #140 | Excellent 60.7% |
| Immigrants | Afghanistan | 83.1 /100 | #141 | Excellent 60.7% |
| Poles | 82.8 /100 | #142 | Excellent 60.7% |
| Canadians | 82.7 /100 | #143 | Excellent 60.6% |
| Czechs | 81.9 /100 | #144 | Excellent 60.6% |
| Slavs | 81.1 /100 | #145 | Excellent 60.6% |
| Scottish | 80.2 /100 | #146 | Excellent 60.5% |
| Immigrants | Kenya | 79.1 /100 | #147 | Good 60.5% |
| Kenyans | 79.0 /100 | #148 | Good 60.5% |
| Brazilians | 79.0 /100 | #149 | Good 60.5% |
| Immigrants | Sudan | 77.8 /100 | #150 | Good 60.4% |
| Albanians | 77.8 /100 | #151 | Good 60.4% |
| Immigrants | Germany | 76.1 /100 | #152 | Good 60.3% |
| Sierra Leoneans | 74.1 /100 | #153 | Good 60.2% |
| Sudanese | 73.0 /100 | #154 | Good 60.2% |
| Moroccans | 72.9 /100 | #155 | Good 60.2% |
| Finns | 72.9 /100 | #156 | Good 60.2% |
| Immigrants | Armenia | 68.8 /100 | #157 | Good 60.0% |
| English | 67.2 /100 | #158 | Good 60.0% |
| Immigrants | Iraq | 67.0 /100 | #159 | Good 60.0% |