Immigrants from Armenia vs Immigrants from Venezuela College, 1 year or more
COMPARE
Immigrants from Armenia
Immigrants from Venezuela
College, 1 year or more
College, 1 year or more Comparison
Immigrants from Armenia
Immigrants from Venezuela
60.0%
COLLEGE, 1 YEAR OR MORE
68.8/ 100
METRIC RATING
157th/ 347
METRIC RANK
61.0%
COLLEGE, 1 YEAR OR MORE
87.9/ 100
METRIC RATING
134th/ 347
METRIC RANK
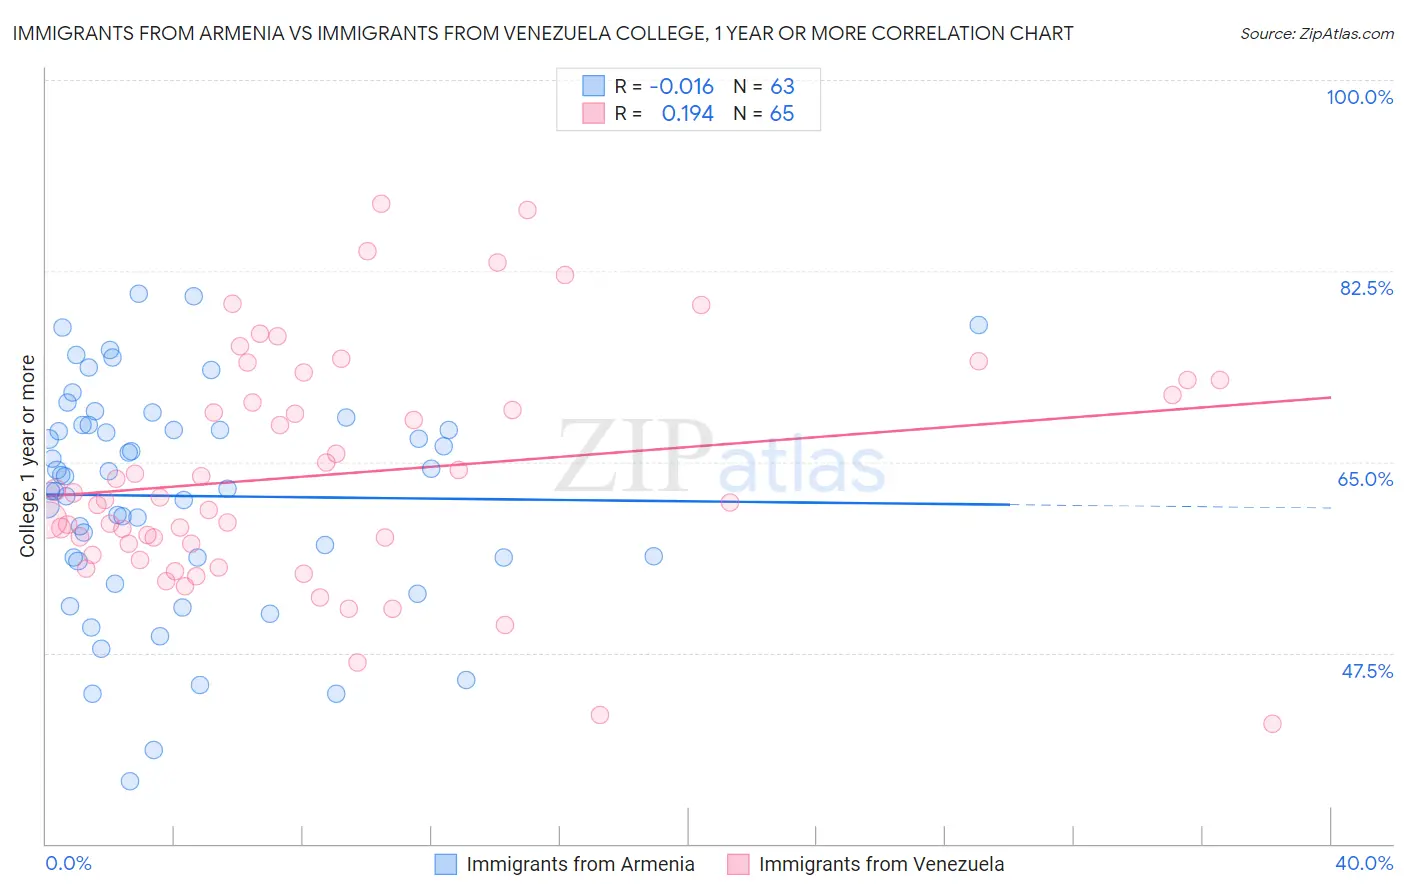
Immigrants from Armenia vs Immigrants from Venezuela College, 1 year or more Correlation Chart
The statistical analysis conducted on geographies consisting of 97,725,183 people shows no correlation between the proportion of Immigrants from Armenia and percentage of population with at least college, 1 year or more education in the United States with a correlation coefficient (R) of -0.016 and weighted average of 60.0%. Similarly, the statistical analysis conducted on geographies consisting of 287,865,065 people shows a poor positive correlation between the proportion of Immigrants from Venezuela and percentage of population with at least college, 1 year or more education in the United States with a correlation coefficient (R) of 0.194 and weighted average of 61.0%, a difference of 1.6%.
College, 1 year or more Correlation Summary
| Measurement | Immigrants from Armenia | Immigrants from Venezuela |
| Minimum | 35.7% | 41.0% |
| Maximum | 80.4% | 88.6% |
| Range | 44.7% | 47.7% |
| Mean | 61.9% | 63.9% |
| Median | 63.7% | 61.5% |
| Interquartile 25% (IQ1) | 56.2% | 57.0% |
| Interquartile 75% (IQ3) | 68.3% | 71.8% |
| Interquartile Range (IQR) | 12.2% | 14.8% |
| Standard Deviation (Sample) | 10.1% | 10.6% |
| Standard Deviation (Population) | 10.0% | 10.5% |
Similar Demographics by College, 1 year or more
Demographics Similar to Immigrants from Armenia by College, 1 year or more
In terms of college, 1 year or more, the demographic groups most similar to Immigrants from Armenia are English (60.0%, a difference of 0.10%), Immigrants from Iraq (60.0%, a difference of 0.11%), South American Indian (60.0%, a difference of 0.12%), Somali (59.9%, a difference of 0.25%), and Sudanese (60.2%, a difference of 0.26%).
| Demographics | Rating | Rank | College, 1 year or more |
| Immigrants | Sudan | 77.8 /100 | #150 | Good 60.4% |
| Albanians | 77.8 /100 | #151 | Good 60.4% |
| Immigrants | Germany | 76.1 /100 | #152 | Good 60.3% |
| Sierra Leoneans | 74.1 /100 | #153 | Good 60.2% |
| Sudanese | 73.0 /100 | #154 | Good 60.2% |
| Moroccans | 72.9 /100 | #155 | Good 60.2% |
| Finns | 72.9 /100 | #156 | Good 60.2% |
| Immigrants | Armenia | 68.8 /100 | #157 | Good 60.0% |
| English | 67.2 /100 | #158 | Good 60.0% |
| Immigrants | Iraq | 67.0 /100 | #159 | Good 60.0% |
| South American Indians | 66.9 /100 | #160 | Good 60.0% |
| Somalis | 64.5 /100 | #161 | Good 59.9% |
| Koreans | 58.5 /100 | #162 | Average 59.7% |
| Immigrants | Somalia | 58.3 /100 | #163 | Average 59.7% |
| Belgians | 58.1 /100 | #164 | Average 59.7% |
Demographics Similar to Immigrants from Venezuela by College, 1 year or more
In terms of college, 1 year or more, the demographic groups most similar to Immigrants from Venezuela are Immigrants from Uzbekistan (61.0%, a difference of 0.010%), Scandinavian (61.0%, a difference of 0.040%), Immigrants from Uganda (60.9%, a difference of 0.060%), Basque (60.9%, a difference of 0.080%), and Slovene (60.9%, a difference of 0.16%).
| Demographics | Rating | Rank | College, 1 year or more |
| Immigrants | Eastern Africa | 91.1 /100 | #127 | Exceptional 61.2% |
| Immigrants | Italy | 91.1 /100 | #128 | Exceptional 61.2% |
| Ugandans | 90.7 /100 | #129 | Exceptional 61.2% |
| Italians | 89.5 /100 | #130 | Excellent 61.1% |
| Immigrants | Morocco | 89.5 /100 | #131 | Excellent 61.1% |
| Scandinavians | 88.2 /100 | #132 | Excellent 61.0% |
| Immigrants | Uzbekistan | 88.0 /100 | #133 | Excellent 61.0% |
| Immigrants | Venezuela | 87.9 /100 | #134 | Excellent 61.0% |
| Immigrants | Uganda | 87.4 /100 | #135 | Excellent 60.9% |
| Basques | 87.2 /100 | #136 | Excellent 60.9% |
| Slovenes | 86.5 /100 | #137 | Excellent 60.9% |
| Taiwanese | 84.3 /100 | #138 | Excellent 60.7% |
| Immigrants | Eritrea | 84.3 /100 | #139 | Excellent 60.7% |
| Iraqis | 83.3 /100 | #140 | Excellent 60.7% |
| Immigrants | Afghanistan | 83.1 /100 | #141 | Excellent 60.7% |