Immigrants from Argentina vs Hopi No Schooling Completed
COMPARE
Immigrants from Argentina
Hopi
No Schooling Completed
No Schooling Completed Comparison
Immigrants from Argentina
Hopi
2.1%
NO SCHOOLING COMPLETED
52.7/ 100
METRIC RATING
172nd/ 347
METRIC RANK
2.2%
NO SCHOOLING COMPLETED
12.9/ 100
METRIC RATING
204th/ 347
METRIC RANK
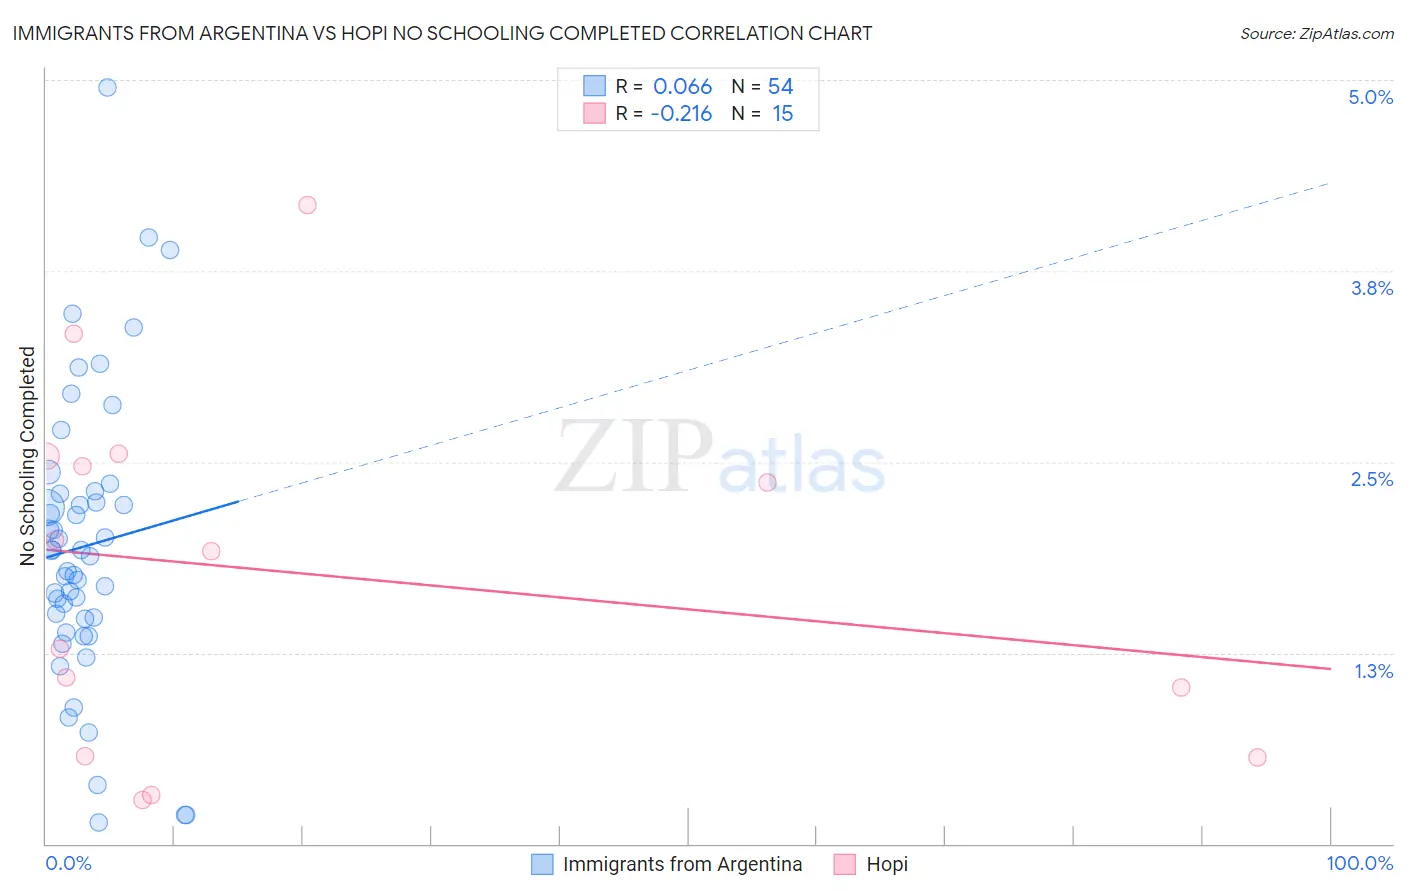
Immigrants from Argentina vs Hopi No Schooling Completed Correlation Chart
The statistical analysis conducted on geographies consisting of 262,849,156 people shows a slight positive correlation between the proportion of Immigrants from Argentina and percentage of population with no schooling in the United States with a correlation coefficient (R) of 0.066 and weighted average of 2.1%. Similarly, the statistical analysis conducted on geographies consisting of 74,568,063 people shows a weak negative correlation between the proportion of Hopi and percentage of population with no schooling in the United States with a correlation coefficient (R) of -0.216 and weighted average of 2.2%, a difference of 6.8%.
No Schooling Completed Correlation Summary
| Measurement | Immigrants from Argentina | Hopi |
| Minimum | 0.14% | 0.29% |
| Maximum | 4.9% | 4.2% |
| Range | 4.8% | 3.9% |
| Mean | 1.9% | 1.8% |
| Median | 1.9% | 1.9% |
| Interquartile 25% (IQ1) | 1.5% | 0.57% |
| Interquartile 75% (IQ3) | 2.3% | 2.5% |
| Interquartile Range (IQR) | 0.82% | 2.0% |
| Standard Deviation (Sample) | 0.94% | 1.2% |
| Standard Deviation (Population) | 0.94% | 1.1% |
Similar Demographics by No Schooling Completed
Demographics Similar to Immigrants from Argentina by No Schooling Completed
In terms of no schooling completed, the demographic groups most similar to Immigrants from Argentina are Immigrants from Belarus (2.1%, a difference of 0.13%), Immigrants from Poland (2.1%, a difference of 0.33%), Immigrants from Micronesia (2.1%, a difference of 0.37%), Argentinean (2.1%, a difference of 0.45%), and Apache (2.1%, a difference of 0.53%).
| Demographics | Rating | Rank | No Schooling Completed |
| Brazilians | 60.2 /100 | #165 | Good 2.1% |
| Dutch West Indians | 59.9 /100 | #166 | Average 2.1% |
| Egyptians | 59.2 /100 | #167 | Average 2.1% |
| Cheyenne | 58.6 /100 | #168 | Average 2.1% |
| Apache | 56.7 /100 | #169 | Average 2.1% |
| Argentineans | 56.0 /100 | #170 | Average 2.1% |
| Immigrants | Poland | 55.2 /100 | #171 | Average 2.1% |
| Immigrants | Argentina | 52.7 /100 | #172 | Average 2.1% |
| Immigrants | Belarus | 51.8 /100 | #173 | Average 2.1% |
| Immigrants | Micronesia | 50.0 /100 | #174 | Average 2.1% |
| Arabs | 46.4 /100 | #175 | Average 2.1% |
| Panamanians | 45.2 /100 | #176 | Average 2.1% |
| Arapaho | 45.0 /100 | #177 | Average 2.1% |
| Pakistanis | 44.7 /100 | #178 | Average 2.1% |
| Immigrants | Kazakhstan | 44.3 /100 | #179 | Average 2.1% |
Demographics Similar to Hopi by No Schooling Completed
In terms of no schooling completed, the demographic groups most similar to Hopi are Laotian (2.2%, a difference of 0.11%), Moroccan (2.2%, a difference of 0.22%), Immigrants from Bahamas (2.2%, a difference of 0.40%), Bahamian (2.2%, a difference of 0.41%), and South American Indian (2.2%, a difference of 0.59%).
| Demographics | Rating | Rank | No Schooling Completed |
| Immigrants | Southern Europe | 23.8 /100 | #197 | Fair 2.2% |
| Immigrants | Chile | 22.7 /100 | #198 | Fair 2.2% |
| Africans | 21.8 /100 | #199 | Fair 2.2% |
| Immigrants | Northern Africa | 19.5 /100 | #200 | Poor 2.2% |
| Costa Ricans | 17.1 /100 | #201 | Poor 2.2% |
| Moroccans | 13.7 /100 | #202 | Poor 2.2% |
| Laotians | 13.3 /100 | #203 | Poor 2.2% |
| Hopi | 12.9 /100 | #204 | Poor 2.2% |
| Immigrants | Bahamas | 11.6 /100 | #205 | Poor 2.2% |
| Bahamians | 11.6 /100 | #206 | Poor 2.2% |
| South American Indians | 11.0 /100 | #207 | Poor 2.2% |
| Uruguayans | 11.0 /100 | #208 | Poor 2.2% |
| Immigrants | Oceania | 10.2 /100 | #209 | Poor 2.2% |
| Natives/Alaskans | 10.0 /100 | #210 | Tragic 2.2% |
| Immigrants | Panama | 8.8 /100 | #211 | Tragic 2.3% |