Immigrants from Argentina vs Immigrants from Sierra Leone No Schooling Completed
COMPARE
Immigrants from Argentina
Immigrants from Sierra Leone
No Schooling Completed
No Schooling Completed Comparison
Immigrants from Argentina
Immigrants from Sierra Leone
2.1%
NO SCHOOLING COMPLETED
52.7/ 100
METRIC RATING
172nd/ 347
METRIC RANK
2.5%
NO SCHOOLING COMPLETED
0.5/ 100
METRIC RATING
262nd/ 347
METRIC RANK
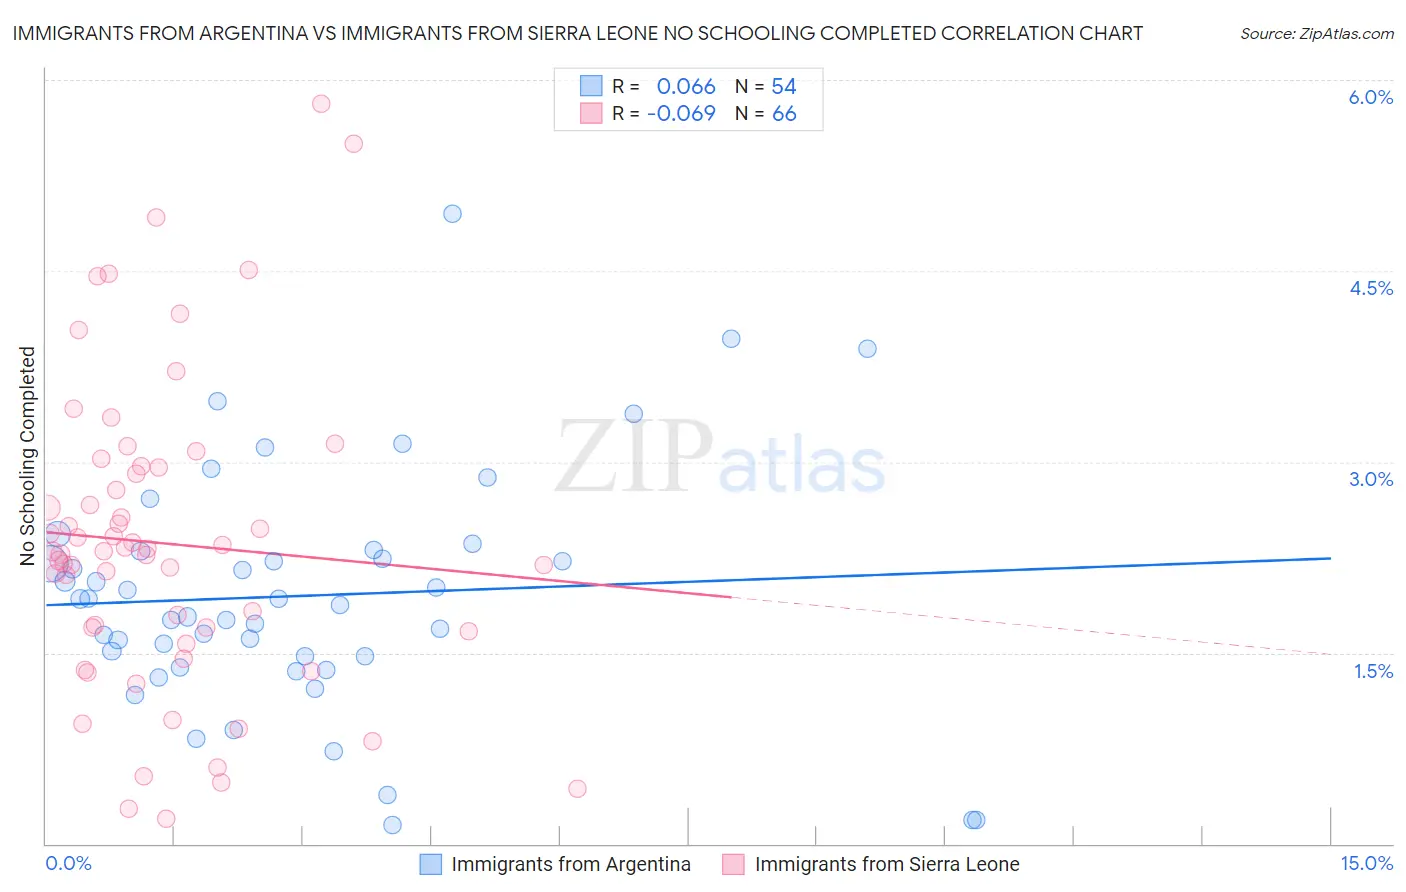
Immigrants from Argentina vs Immigrants from Sierra Leone No Schooling Completed Correlation Chart
The statistical analysis conducted on geographies consisting of 262,849,156 people shows a slight positive correlation between the proportion of Immigrants from Argentina and percentage of population with no schooling in the United States with a correlation coefficient (R) of 0.066 and weighted average of 2.1%. Similarly, the statistical analysis conducted on geographies consisting of 101,407,363 people shows a slight negative correlation between the proportion of Immigrants from Sierra Leone and percentage of population with no schooling in the United States with a correlation coefficient (R) of -0.069 and weighted average of 2.5%, a difference of 18.4%.
No Schooling Completed Correlation Summary
| Measurement | Immigrants from Argentina | Immigrants from Sierra Leone |
| Minimum | 0.14% | 0.19% |
| Maximum | 4.9% | 5.8% |
| Range | 4.8% | 5.6% |
| Mean | 1.9% | 2.4% |
| Median | 1.9% | 2.3% |
| Interquartile 25% (IQ1) | 1.5% | 1.7% |
| Interquartile 75% (IQ3) | 2.3% | 3.0% |
| Interquartile Range (IQR) | 0.82% | 1.3% |
| Standard Deviation (Sample) | 0.94% | 1.2% |
| Standard Deviation (Population) | 0.94% | 1.2% |
Similar Demographics by No Schooling Completed
Demographics Similar to Immigrants from Argentina by No Schooling Completed
In terms of no schooling completed, the demographic groups most similar to Immigrants from Argentina are Immigrants from Belarus (2.1%, a difference of 0.13%), Immigrants from Poland (2.1%, a difference of 0.33%), Immigrants from Micronesia (2.1%, a difference of 0.37%), Argentinean (2.1%, a difference of 0.45%), and Apache (2.1%, a difference of 0.53%).
| Demographics | Rating | Rank | No Schooling Completed |
| Brazilians | 60.2 /100 | #165 | Good 2.1% |
| Dutch West Indians | 59.9 /100 | #166 | Average 2.1% |
| Egyptians | 59.2 /100 | #167 | Average 2.1% |
| Cheyenne | 58.6 /100 | #168 | Average 2.1% |
| Apache | 56.7 /100 | #169 | Average 2.1% |
| Argentineans | 56.0 /100 | #170 | Average 2.1% |
| Immigrants | Poland | 55.2 /100 | #171 | Average 2.1% |
| Immigrants | Argentina | 52.7 /100 | #172 | Average 2.1% |
| Immigrants | Belarus | 51.8 /100 | #173 | Average 2.1% |
| Immigrants | Micronesia | 50.0 /100 | #174 | Average 2.1% |
| Arabs | 46.4 /100 | #175 | Average 2.1% |
| Panamanians | 45.2 /100 | #176 | Average 2.1% |
| Arapaho | 45.0 /100 | #177 | Average 2.1% |
| Pakistanis | 44.7 /100 | #178 | Average 2.1% |
| Immigrants | Kazakhstan | 44.3 /100 | #179 | Average 2.1% |
Demographics Similar to Immigrants from Sierra Leone by No Schooling Completed
In terms of no schooling completed, the demographic groups most similar to Immigrants from Sierra Leone are Immigrants from Liberia (2.5%, a difference of 0.17%), Indian (Asian) (2.5%, a difference of 0.30%), Armenian (2.5%, a difference of 0.35%), Immigrants from Ethiopia (2.5%, a difference of 0.48%), and West Indian (2.5%, a difference of 0.48%).
| Demographics | Rating | Rank | No Schooling Completed |
| Ethiopians | 0.8 /100 | #255 | Tragic 2.4% |
| Yaqui | 0.8 /100 | #256 | Tragic 2.4% |
| Immigrants | South America | 0.6 /100 | #257 | Tragic 2.5% |
| Assyrians/Chaldeans/Syriacs | 0.6 /100 | #258 | Tragic 2.5% |
| Immigrants | Jamaica | 0.6 /100 | #259 | Tragic 2.5% |
| Immigrants | Ethiopia | 0.6 /100 | #260 | Tragic 2.5% |
| Armenians | 0.5 /100 | #261 | Tragic 2.5% |
| Immigrants | Sierra Leone | 0.5 /100 | #262 | Tragic 2.5% |
| Immigrants | Liberia | 0.4 /100 | #263 | Tragic 2.5% |
| Indians (Asian) | 0.4 /100 | #264 | Tragic 2.5% |
| West Indians | 0.4 /100 | #265 | Tragic 2.5% |
| Fijians | 0.4 /100 | #266 | Tragic 2.5% |
| Yuman | 0.4 /100 | #267 | Tragic 2.5% |
| Taiwanese | 0.3 /100 | #268 | Tragic 2.5% |
| Immigrants | Nigeria | 0.2 /100 | #269 | Tragic 2.5% |