Immigrants from Argentina vs Chickasaw Bachelor's Degree
COMPARE
Immigrants from Argentina
Chickasaw
Bachelor's Degree
Bachelor's Degree Comparison
Immigrants from Argentina
Chickasaw
42.8%
BACHELOR'S DEGREE
99.6/ 100
METRIC RATING
71st/ 347
METRIC RANK
30.4%
BACHELOR'S DEGREE
0.0/ 100
METRIC RATING
299th/ 347
METRIC RANK
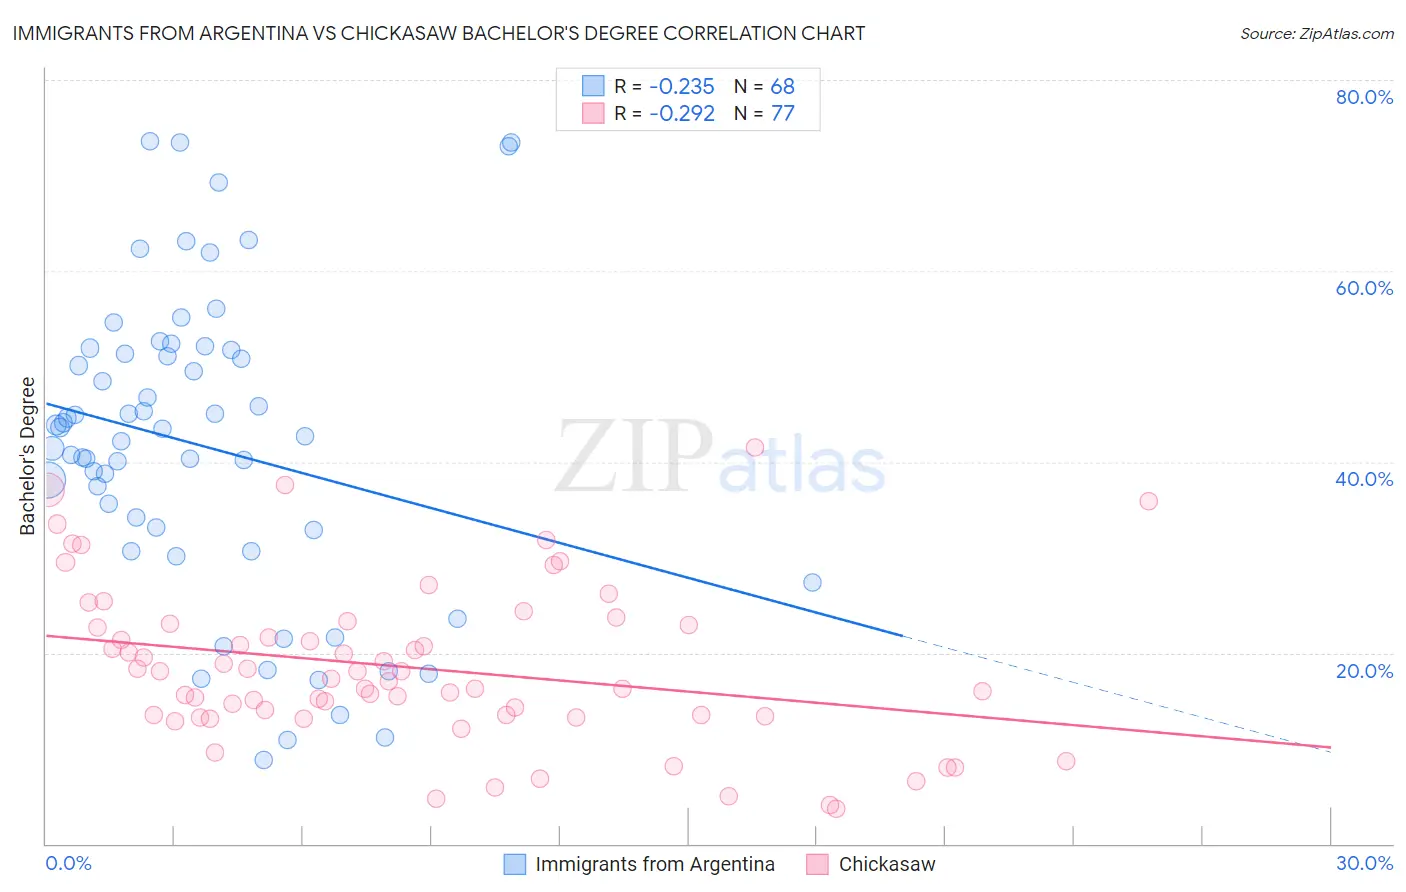
Immigrants from Argentina vs Chickasaw Bachelor's Degree Correlation Chart
The statistical analysis conducted on geographies consisting of 264,417,029 people shows a weak negative correlation between the proportion of Immigrants from Argentina and percentage of population with at least bachelor's degree education in the United States with a correlation coefficient (R) of -0.235 and weighted average of 42.8%. Similarly, the statistical analysis conducted on geographies consisting of 147,721,658 people shows a weak negative correlation between the proportion of Chickasaw and percentage of population with at least bachelor's degree education in the United States with a correlation coefficient (R) of -0.292 and weighted average of 30.4%, a difference of 40.9%.
Bachelor's Degree Correlation Summary
| Measurement | Immigrants from Argentina | Chickasaw |
| Minimum | 8.8% | 3.6% |
| Maximum | 73.6% | 41.5% |
| Range | 64.8% | 37.9% |
| Mean | 41.6% | 18.5% |
| Median | 43.1% | 17.3% |
| Interquartile 25% (IQ1) | 31.8% | 13.4% |
| Interquartile 75% (IQ3) | 51.5% | 22.9% |
| Interquartile Range (IQR) | 19.8% | 9.5% |
| Standard Deviation (Sample) | 16.1% | 8.3% |
| Standard Deviation (Population) | 16.0% | 8.3% |
Similar Demographics by Bachelor's Degree
Demographics Similar to Immigrants from Argentina by Bachelor's Degree
In terms of bachelor's degree, the demographic groups most similar to Immigrants from Argentina are Ethiopian (42.8%, a difference of 0.090%), Immigrants from Uzbekistan (42.8%, a difference of 0.14%), Immigrants from Romania (42.9%, a difference of 0.26%), Bhutanese (42.7%, a difference of 0.36%), and Immigrants from Zimbabwe (42.6%, a difference of 0.58%).
| Demographics | Rating | Rank | Bachelor's Degree |
| Argentineans | 99.7 /100 | #64 | Exceptional 43.3% |
| Zimbabweans | 99.7 /100 | #65 | Exceptional 43.3% |
| Immigrants | Netherlands | 99.7 /100 | #66 | Exceptional 43.3% |
| Egyptians | 99.7 /100 | #67 | Exceptional 43.3% |
| Immigrants | Indonesia | 99.7 /100 | #68 | Exceptional 43.3% |
| Immigrants | Pakistan | 99.7 /100 | #69 | Exceptional 43.1% |
| Immigrants | Romania | 99.6 /100 | #70 | Exceptional 42.9% |
| Immigrants | Argentina | 99.6 /100 | #71 | Exceptional 42.8% |
| Ethiopians | 99.5 /100 | #72 | Exceptional 42.8% |
| Immigrants | Uzbekistan | 99.5 /100 | #73 | Exceptional 42.8% |
| Bhutanese | 99.5 /100 | #74 | Exceptional 42.7% |
| Immigrants | Zimbabwe | 99.4 /100 | #75 | Exceptional 42.6% |
| Immigrants | Egypt | 99.4 /100 | #76 | Exceptional 42.6% |
| Immigrants | Eastern Europe | 99.4 /100 | #77 | Exceptional 42.5% |
| Immigrants | Ethiopia | 99.4 /100 | #78 | Exceptional 42.5% |
Demographics Similar to Chickasaw by Bachelor's Degree
In terms of bachelor's degree, the demographic groups most similar to Chickasaw are Immigrants from Micronesia (30.4%, a difference of 0.020%), Immigrants from Cuba (30.3%, a difference of 0.23%), Mexican American Indian (30.2%, a difference of 0.51%), Chippewa (30.6%, a difference of 0.52%), and Bangladeshi (30.2%, a difference of 0.68%).
| Demographics | Rating | Rank | Bachelor's Degree |
| Ute | 0.1 /100 | #292 | Tragic 30.9% |
| Cape Verdeans | 0.1 /100 | #293 | Tragic 30.9% |
| Immigrants | Guatemala | 0.0 /100 | #294 | Tragic 30.8% |
| Immigrants | Dominican Republic | 0.0 /100 | #295 | Tragic 30.7% |
| Puget Sound Salish | 0.0 /100 | #296 | Tragic 30.7% |
| Immigrants | Haiti | 0.0 /100 | #297 | Tragic 30.6% |
| Chippewa | 0.0 /100 | #298 | Tragic 30.6% |
| Chickasaw | 0.0 /100 | #299 | Tragic 30.4% |
| Immigrants | Micronesia | 0.0 /100 | #300 | Tragic 30.4% |
| Immigrants | Cuba | 0.0 /100 | #301 | Tragic 30.3% |
| Mexican American Indians | 0.0 /100 | #302 | Tragic 30.2% |
| Bangladeshis | 0.0 /100 | #303 | Tragic 30.2% |
| Cherokee | 0.0 /100 | #304 | Tragic 30.2% |
| Immigrants | Latin America | 0.0 /100 | #305 | Tragic 30.1% |
| Immigrants | Yemen | 0.0 /100 | #306 | Tragic 29.9% |