Immigrants from Argentina vs Immigrants from Liberia Bachelor's Degree
COMPARE
Immigrants from Argentina
Immigrants from Liberia
Bachelor's Degree
Bachelor's Degree Comparison
Immigrants from Argentina
Immigrants from Liberia
42.8%
BACHELOR'S DEGREE
99.6/ 100
METRIC RATING
71st/ 347
METRIC RANK
33.5%
BACHELOR'S DEGREE
0.9/ 100
METRIC RATING
249th/ 347
METRIC RANK
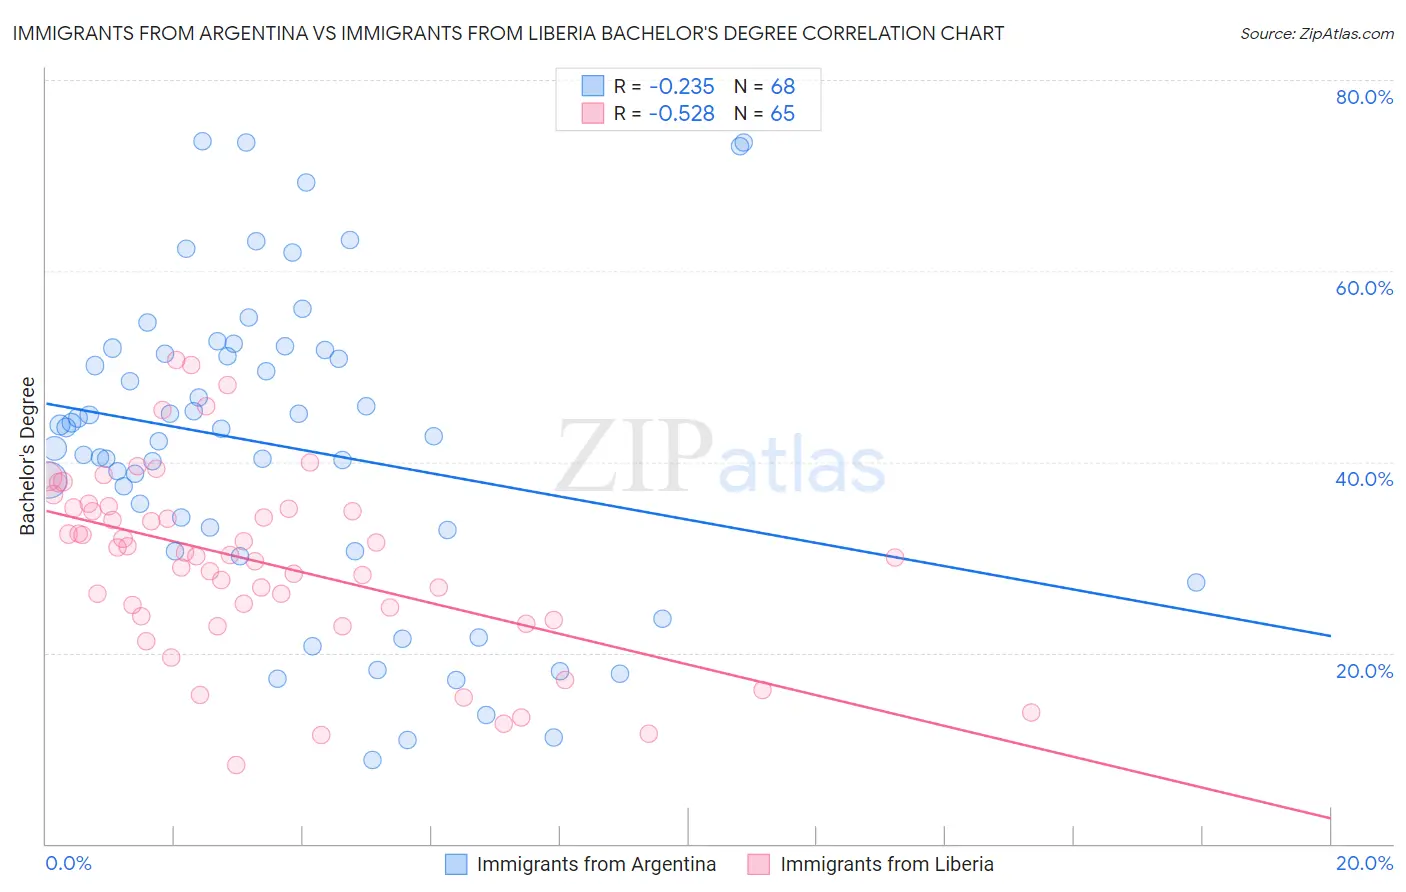
Immigrants from Argentina vs Immigrants from Liberia Bachelor's Degree Correlation Chart
The statistical analysis conducted on geographies consisting of 264,417,029 people shows a weak negative correlation between the proportion of Immigrants from Argentina and percentage of population with at least bachelor's degree education in the United States with a correlation coefficient (R) of -0.235 and weighted average of 42.8%. Similarly, the statistical analysis conducted on geographies consisting of 135,292,805 people shows a substantial negative correlation between the proportion of Immigrants from Liberia and percentage of population with at least bachelor's degree education in the United States with a correlation coefficient (R) of -0.528 and weighted average of 33.5%, a difference of 27.7%.
Bachelor's Degree Correlation Summary
| Measurement | Immigrants from Argentina | Immigrants from Liberia |
| Minimum | 8.8% | 8.2% |
| Maximum | 73.6% | 50.7% |
| Range | 64.8% | 42.4% |
| Mean | 41.6% | 29.4% |
| Median | 43.1% | 30.3% |
| Interquartile 25% (IQ1) | 31.8% | 23.6% |
| Interquartile 75% (IQ3) | 51.5% | 35.1% |
| Interquartile Range (IQR) | 19.8% | 11.5% |
| Standard Deviation (Sample) | 16.1% | 9.5% |
| Standard Deviation (Population) | 16.0% | 9.5% |
Similar Demographics by Bachelor's Degree
Demographics Similar to Immigrants from Argentina by Bachelor's Degree
In terms of bachelor's degree, the demographic groups most similar to Immigrants from Argentina are Ethiopian (42.8%, a difference of 0.090%), Immigrants from Uzbekistan (42.8%, a difference of 0.14%), Immigrants from Romania (42.9%, a difference of 0.26%), Bhutanese (42.7%, a difference of 0.36%), and Immigrants from Zimbabwe (42.6%, a difference of 0.58%).
| Demographics | Rating | Rank | Bachelor's Degree |
| Argentineans | 99.7 /100 | #64 | Exceptional 43.3% |
| Zimbabweans | 99.7 /100 | #65 | Exceptional 43.3% |
| Immigrants | Netherlands | 99.7 /100 | #66 | Exceptional 43.3% |
| Egyptians | 99.7 /100 | #67 | Exceptional 43.3% |
| Immigrants | Indonesia | 99.7 /100 | #68 | Exceptional 43.3% |
| Immigrants | Pakistan | 99.7 /100 | #69 | Exceptional 43.1% |
| Immigrants | Romania | 99.6 /100 | #70 | Exceptional 42.9% |
| Immigrants | Argentina | 99.6 /100 | #71 | Exceptional 42.8% |
| Ethiopians | 99.5 /100 | #72 | Exceptional 42.8% |
| Immigrants | Uzbekistan | 99.5 /100 | #73 | Exceptional 42.8% |
| Bhutanese | 99.5 /100 | #74 | Exceptional 42.7% |
| Immigrants | Zimbabwe | 99.4 /100 | #75 | Exceptional 42.6% |
| Immigrants | Egypt | 99.4 /100 | #76 | Exceptional 42.6% |
| Immigrants | Eastern Europe | 99.4 /100 | #77 | Exceptional 42.5% |
| Immigrants | Ethiopia | 99.4 /100 | #78 | Exceptional 42.5% |
Demographics Similar to Immigrants from Liberia by Bachelor's Degree
In terms of bachelor's degree, the demographic groups most similar to Immigrants from Liberia are Indonesian (33.5%, a difference of 0.010%), Cree (33.6%, a difference of 0.13%), Immigrants from Congo (33.6%, a difference of 0.14%), Jamaican (33.6%, a difference of 0.23%), and Immigrants from Fiji (33.7%, a difference of 0.59%).
| Demographics | Rating | Rank | Bachelor's Degree |
| Immigrants | Nonimmigrants | 1.8 /100 | #242 | Tragic 34.2% |
| Immigrants | Guyana | 1.4 /100 | #243 | Tragic 33.9% |
| Delaware | 1.2 /100 | #244 | Tragic 33.8% |
| Immigrants | Fiji | 1.2 /100 | #245 | Tragic 33.7% |
| Jamaicans | 1.0 /100 | #246 | Tragic 33.6% |
| Immigrants | Congo | 1.0 /100 | #247 | Tragic 33.6% |
| Cree | 1.0 /100 | #248 | Tragic 33.6% |
| Immigrants | Liberia | 0.9 /100 | #249 | Tragic 33.5% |
| Indonesians | 0.9 /100 | #250 | Tragic 33.5% |
| Japanese | 0.7 /100 | #251 | Tragic 33.3% |
| Immigrants | Bahamas | 0.7 /100 | #252 | Tragic 33.3% |
| U.S. Virgin Islanders | 0.7 /100 | #253 | Tragic 33.2% |
| Native Hawaiians | 0.7 /100 | #254 | Tragic 33.2% |
| Iroquois | 0.7 /100 | #255 | Tragic 33.2% |
| Nicaraguans | 0.6 /100 | #256 | Tragic 33.1% |