Immigrants from Laos vs Chickasaw Bachelor's Degree
COMPARE
Immigrants from Laos
Chickasaw
Bachelor's Degree
Bachelor's Degree Comparison
Immigrants from Laos
Chickasaw
31.6%
BACHELOR'S DEGREE
0.1/ 100
METRIC RATING
280th/ 347
METRIC RANK
30.4%
BACHELOR'S DEGREE
0.0/ 100
METRIC RATING
299th/ 347
METRIC RANK
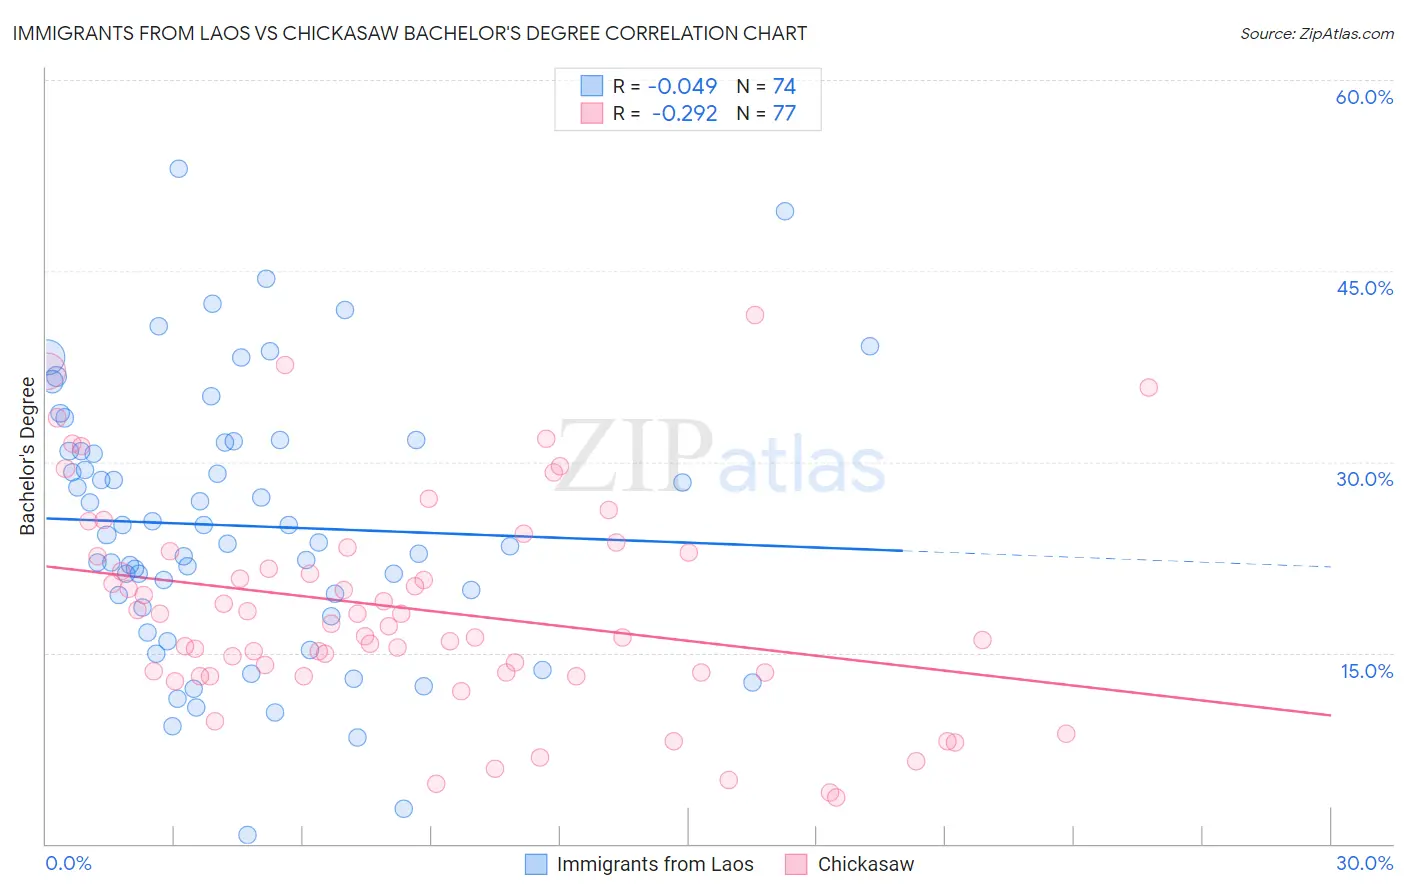
Immigrants from Laos vs Chickasaw Bachelor's Degree Correlation Chart
The statistical analysis conducted on geographies consisting of 201,474,630 people shows no correlation between the proportion of Immigrants from Laos and percentage of population with at least bachelor's degree education in the United States with a correlation coefficient (R) of -0.049 and weighted average of 31.6%. Similarly, the statistical analysis conducted on geographies consisting of 147,721,658 people shows a weak negative correlation between the proportion of Chickasaw and percentage of population with at least bachelor's degree education in the United States with a correlation coefficient (R) of -0.292 and weighted average of 30.4%, a difference of 4.0%.
Bachelor's Degree Correlation Summary
| Measurement | Immigrants from Laos | Chickasaw |
| Minimum | 0.64% | 3.6% |
| Maximum | 53.0% | 41.5% |
| Range | 52.4% | 37.9% |
| Mean | 25.0% | 18.5% |
| Median | 24.0% | 17.3% |
| Interquartile 25% (IQ1) | 18.6% | 13.4% |
| Interquartile 75% (IQ3) | 31.5% | 22.9% |
| Interquartile Range (IQR) | 12.9% | 9.5% |
| Standard Deviation (Sample) | 10.5% | 8.3% |
| Standard Deviation (Population) | 10.4% | 8.3% |
Demographics Similar to Immigrants from Laos and Chickasaw by Bachelor's Degree
In terms of bachelor's degree, the demographic groups most similar to Immigrants from Laos are Hawaiian (31.6%, a difference of 0.050%), Blackfeet (31.5%, a difference of 0.46%), Immigrants from Caribbean (31.4%, a difference of 0.60%), Honduran (31.3%, a difference of 0.88%), and Haitian (31.3%, a difference of 0.91%). Similarly, the demographic groups most similar to Chickasaw are Chippewa (30.6%, a difference of 0.52%), Immigrants from Haiti (30.6%, a difference of 0.77%), Puget Sound Salish (30.7%, a difference of 0.83%), Immigrants from Dominican Republic (30.7%, a difference of 0.93%), and Immigrants from Guatemala (30.8%, a difference of 1.2%).
| Demographics | Rating | Rank | Bachelor's Degree |
| Hawaiians | 0.1 /100 | #279 | Tragic 31.6% |
| Immigrants | Laos | 0.1 /100 | #280 | Tragic 31.6% |
| Blackfeet | 0.1 /100 | #281 | Tragic 31.5% |
| Immigrants | Caribbean | 0.1 /100 | #282 | Tragic 31.4% |
| Hondurans | 0.1 /100 | #283 | Tragic 31.3% |
| Haitians | 0.1 /100 | #284 | Tragic 31.3% |
| Aleuts | 0.1 /100 | #285 | Tragic 31.3% |
| Immigrants | El Salvador | 0.1 /100 | #286 | Tragic 31.3% |
| Ottawa | 0.1 /100 | #287 | Tragic 31.1% |
| Guatemalans | 0.1 /100 | #288 | Tragic 31.0% |
| Puerto Ricans | 0.1 /100 | #289 | Tragic 31.0% |
| Immigrants | Honduras | 0.1 /100 | #290 | Tragic 30.9% |
| Blacks/African Americans | 0.1 /100 | #291 | Tragic 30.9% |
| Ute | 0.1 /100 | #292 | Tragic 30.9% |
| Cape Verdeans | 0.1 /100 | #293 | Tragic 30.9% |
| Immigrants | Guatemala | 0.0 /100 | #294 | Tragic 30.8% |
| Immigrants | Dominican Republic | 0.0 /100 | #295 | Tragic 30.7% |
| Puget Sound Salish | 0.0 /100 | #296 | Tragic 30.7% |
| Immigrants | Haiti | 0.0 /100 | #297 | Tragic 30.6% |
| Chippewa | 0.0 /100 | #298 | Tragic 30.6% |
| Chickasaw | 0.0 /100 | #299 | Tragic 30.4% |